The CS2 Skin Market Is Worth $5 Billion Again — But 95% of Skins Are Still Down
The CS2 Skin Market Is Worth $5 Billion Again — But 95% of Skins Are Still Down
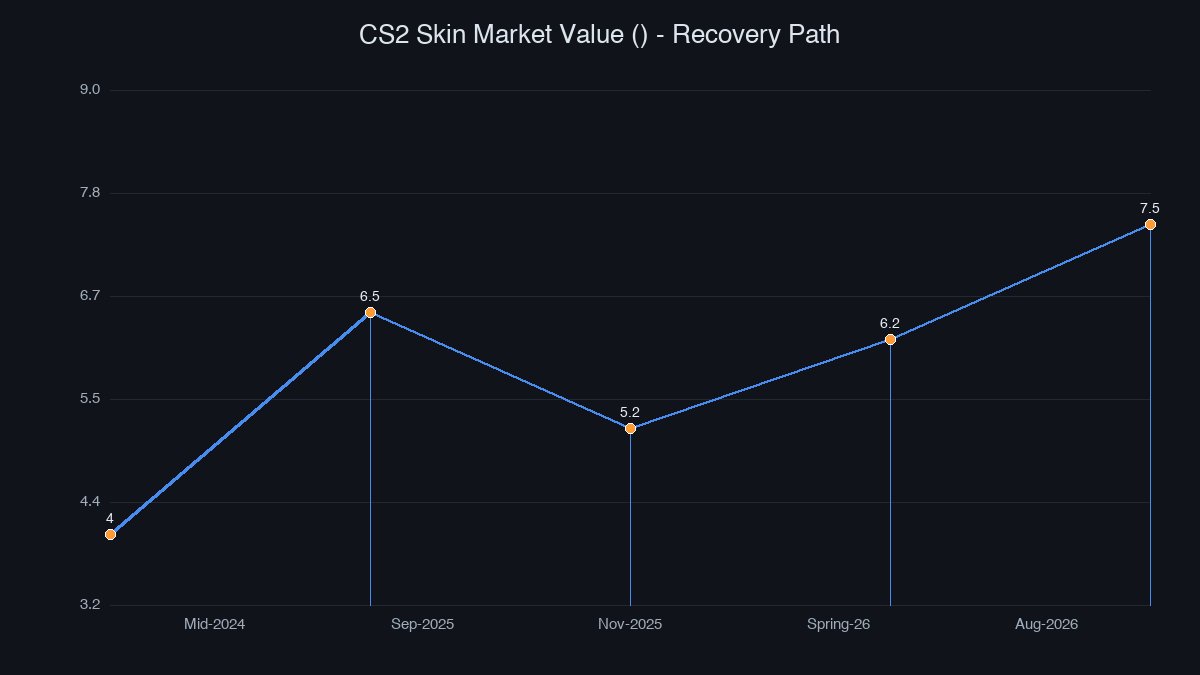
The CS2 skin market just crossed $5.1 billion in tracked value. On the same day, a separate data set showed that 95% of comparable skins are still cheaper than they were back in March. Both numbers are real, and they were published within days of each other. They just aren't telling the same story.
That contradiction is the most important thing to understand about the CS2 economy right now. The market has "recovered" in the headline that everyone repeats — but for most individual skins, the recovery never happened. Here's what the numbers actually show.
The reason these two pictures conflict is that they measure different things. Market cap counts dollars in motion across marketplaces. The index counts what each individual item is actually worth. When those two diverge, it almost always means a repricing is underway — and right now, that's exactly what's happening across the whole skin economy.
A Market Worth Billions, an Index Still in the Red
Start with the bull case. cs2.sh, which quotes prices from six major marketplaces — BUFF, Youpin, CSFloat, Skinport, Steam, and C5Game — puts the combined tracked market value at $5.1 billion as of August 31, 2026. That covers 50,528 items across 131 collections, refreshed every few minutes.
Independent analysts put the number even higher. A long-running price spreadsheet tracking 400+ skins since 2023 estimates total valuation in the $6.7–8 billion range. By either measure, the CS2 skin economy is enormous and, in dollar terms, roughly back to where it was before last year's crash.
Now the bear case. The same cs2.sh data includes a Broad Market Index that covers every priced item, set against a base of 1000 in January 2024. It currently sits at 686.6. That's down about 31% from the baseline. The market cap recovered. The average price did not.
The Median Skin Lost 28.8%
The index number isn't an outlier — it matches what a second tracker found at the item level. csdb.gg compared every comparable skin between a March 2, 2026 baseline and an August snapshot. The result: 47 skins gained more than 1%, while 1,131 skins lost more than 1%.
The median change across all comparable skins was -28.8%. And the share of skins that declined? 95%. This is not a market where a few winners dragged down an otherwise healthy average. It's a broad, near-universal decline that a handful of supply-closed outliers are quietly bucking.
The category breakdown shows exactly where the pain concentrated:
- Knives: -37.8% (306 skins compared)
- Gloves: -33.1% (72 skins compared)
- SMGs: -26.5% (142 skins compared)
- Rifles: -26.1% (312 skins compared)
- Heavy: -24.4% (103 skins compared)
- Pistols: -22.7% (248 skins compared)
Notice the pattern: the two categories whose supply mechanics changed in October 2025 — knives and gloves — sit at the very bottom of the list.
The median matters here more than the average ever could. A single blue-gem Karambit selling for seven figures can drag an average upward while most skins sit completely still. The median — the exact midpoint of thousands of items — can't be fooled by a few headline sales, which is why a -28.8% median is a much harsher verdict than most traders want to hear.
Why the Numbers Split Apart
To understand the gap between "worth billions" and "down 28.8%", you have to go back to October 2025. That's when Valve updated the trade-up contract system so that players could convert five Covert-grade skins into a knife or a pair of gloves.
Overnight, the ceiling changed. Covert skins were no longer the top of the pyramid — they became raw material. Over roughly six weeks, most case indexes gave back 25–40% from their peak, and inventories that had only ever gone up showed red for the first time in a year.
The recovery that followed was real, but it was a recovery in liquidity, not in price. Buyers who had been priced out of knives and gloves re-entered at the new, lower price points. That influx of volume pushed total market value back up toward $5 billion — but it did so by trading more units at lower prices, not by restoring the old price tags.
This is why the market cap and the index tell different stories. Market cap counts dollars in motion. The index counts what each item is actually worth. More activity can lift the first while the second stays flat or keeps falling.
Float value has become a bigger factor than before, too. With knife and glove prices lower, the percentage gap between a 0.01 float and a 0.06 float on high-value skins has widened, because buyers who previously couldn't afford the top tier are now paying meaningful premiums for the cleanest examples. Pattern hunting on Case Hardened and Fade finishes has followed the same logic — when the base price falls, the premium for the rare version grows.
The Only Skins Still Gaining
If 95% of skins are down, the interesting question is what the other 5% have in common. The answer, according to the same data, is simple: supply that cannot grow.
The gainers skew heavily toward older, discontinued-collection skins. No active case or collection drops them, so the supply is permanently closed. When even modest collector demand shows up, there's no new inventory to absorb it, and the price moves. It's the same logic that has always driven the top of the market — scarcity — working on a smaller, quieter scale.
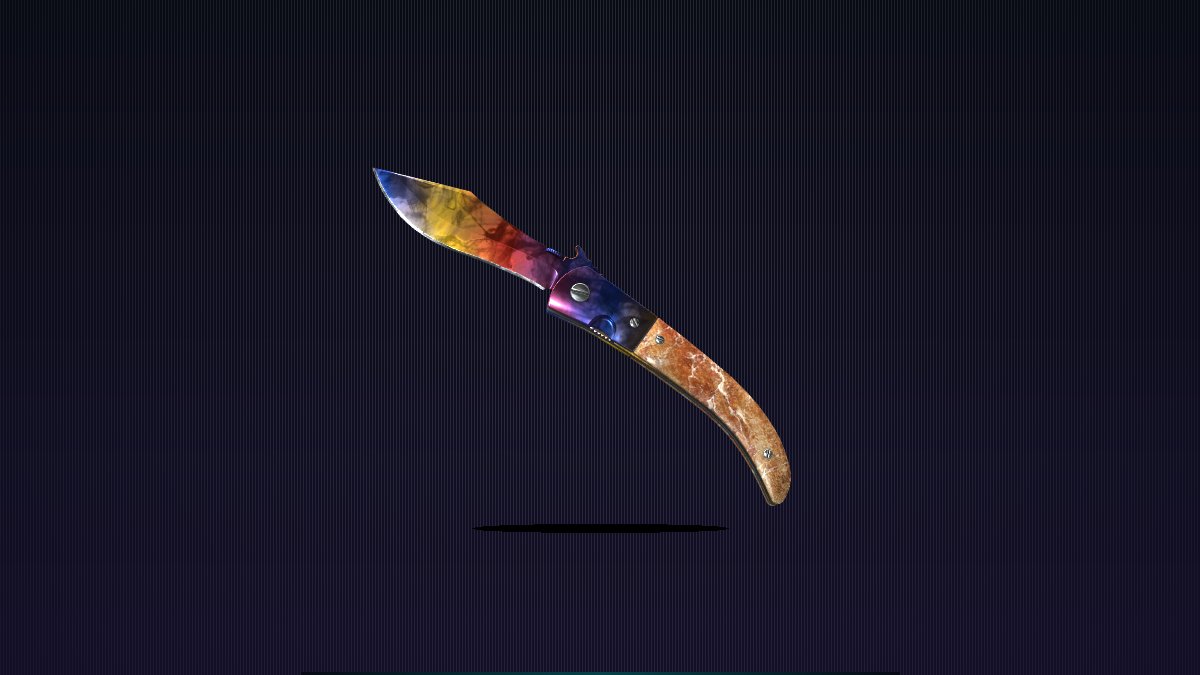
A knife like the ★ Navaja Knife | Marble Fade is a useful example. The Marble Fade finish is one of the most recognizable premium patterns in CS2, and knives as a category have been the hardest-hit segment since the trade-up update. The items holding value best are the ones with a finish people still chase and a supply that isn't being refilled.
Where This Leaves Traders
The practical takeaway is to stop reading the headline number and start reading the index. A $5 billion market sounds healthy; a 686.6 index and a -28.8% median tell you that most positions bought at 2024 or 2025 prices are still underwater.
If you're buying for value retention, the supply-closed items are where the resilience is. If you're buying for volume and liquidity, the mid-tier is where the activity lives. And if you want exposure to the categories people actually open and use every day, case openings remain the clearest demand signal in the whole economy — the Phantom Cache case alone has been opened over 98,000 times, which is real, verifiable demand converting cash into skins every single day.
What surprised us most about the whole episode isn't the crash — it's the resilience of the trade-up system itself. After October 2025, plenty of people predicted the contract would be nerfed or removed entirely. Instead, the market absorbed it, and trade-ups became a standard part of how traders convert inventory. The five-Covert-to-knife mechanic is now priced into the market rather than breaking it — which is exactly how the index can sit at 686 while the market cap reads $5 billion.
The market is not crashing, and it's not euphoric. It's consolidating — with the dollar total masking a quiet repricing underneath. Understand which of the two numbers describes your inventory, and the recovery stops being a headline and becomes a roadmap.