September Is Supposed to Be CS2's Rally Month. 4,800 Skins Didn't Get the Memo.

September Is Supposed to Be CS2's Rally Month. 4,800 Skins Didn't Get the Memo.
Every seasonal guide about the CS2 skin market says the same thing about this stretch of the calendar: September and October are when prices climb. The logic is tidy. The summer sale drains inventories in June and July, tournament season restarts, and demand builds toward the next Major. One widely repeated breakdown puts the September-October rally at 12% to 20% on popular skins, with gains of 10% to 20% in the month before a big event.
So here is the awkward part. On the live tape I checked this week, 4,800 tracked skins were falling against 4,200 rising. The median index is down 5.0% over 90 days. Four days into September, more than 16,000 matched listings had moved lower against just over 10,000 that moved higher. The calendar says rally. The order book says something else.
The Bull Case: the Calendar Isn't Random
Before dismissing the seasonal pattern, look at what it has actually predicted. These are not vibes. The pattern was built from tracked prices, and its examples are specific.
The Butterfly Knife | Crimson Web in Minimal Wear is the neatest illustration. It averaged $1,420 in December 2025, climbed to $1,610 by March 2026 as tournament season restarted, sagged to $1,480 in the June-July dip, and printed a $1,740 peak in September 2026. Four readings, four matching turns — down through the holidays, up into spring, down through summer, up into autumn.
Tournament mechanics show up the same way elsewhere. The M9 Bayonet | Doppler Phase 2 fell from $1,240 to $1,095 in the two weeks after IEM Katowice 2026, then recovered to $1,310 before the next Major. And when an operation launched in March 2026, the USP-S | Kill Confirmed gained 22% in 72 hours as players liquidated inventory for passes and new containers. Post-major dips of 8% to 15% followed by pre-major recoveries are the most repeatable single pattern in this market.
There is a real mechanism underneath all of it: attention. Tournament viewership pulls players back into the game, loadout refreshes follow, and the items people see on stream are the items they buy. That part of the bull case does not depend on anyone's spreadsheet.
The Bear Case: What the Tape Actually Says
The problem is scope. The calendar describes the top of the market — the visible, liquid, recognizable items that get written about — and then gets applied to everything.
Look at the split inside the same week. Of the skins tracked with enough depth to be measurable, 40% rose and 46% fell, with 4.2K up against 4.8K down. That is not a rally with a few laggards. That is a market tilted the wrong way while its leaders print green.
The middle of the distribution tells the story more clearly than the headlines. Across 34,333 matched listing references over one September week, the median move was 0.00% — dead flat. Yet 16,086 references moved lower against 10,158 higher, and 8,089 sat inside a noise band of plus or minus 0.25%. When almost 6,000 more listings are falling than rising and the median still reads zero, the median is hiding the redistribution, not describing it.
Split the market by variant and the tilt gets sharper. Matched StatTrak sets moved a median of -5.00%, with 2,169 references lower against 846 higher — a wider skew than the standard-skin set, which ran a median of -4.66% in the same window. The kill-counter premium is not cushioning anything right now; it is amplifying the downside. Meanwhile event-tied Cologne items stayed flat at a 0.00% median, but with 225 references falling against 85 rising, and the event shop stays open through September 29, so that supply is still being handed out.
Then there is the part of the market that never makes the seasonal guide at all. The bottom tier is not consolidating. It is deflating, with real volume behind the declines. Between two market snapshots 18 days apart, these were among the 40 biggest fallers — items listed on at least eight venues and priced above a dollar, so nothing here is a single-listing artifact:
- XM1014 | Charter: $0.84, down 41.5%, with 599 sales a day across 22 markets
- Negev | Palm: $2.74, down 41.3%, 278 sales a day
- MP5-SD | Autumn Twilly: $5.41, down 39.7%, 596 sales a day
- MAG-7 | Bulldozer: $11.33, down 37.6%, 1,200 sales a day
- MP7 | Gunsmoke: $0.73, down 36.5%, 1,200 sales a day
- PP-Bizon | Modern Hunter: $14.97, down 33.4%, 160 sales a day
- MAG-7 | Cinquedea: $425.73, down 30.8%, 57 sales a day
- MAC-10 | Red Filigree: $87.99, down 28.0%, 92 sales a day
Hundreds to thousands of transactions a day, and prices still sliding 30% to 40% in under three weeks. That is not noise and it is not manipulation — it is supply doing what supply does. 38.25% of tracked items now sit below $1, and the mass of that block keeps growing.
Container prices make the same point from the supply side. One case in the active drop pool, the Kilowatt Case, listed at $0.13 and fell 33.8% in 22 days, while a discontinued container like the Chroma 3 Case held at $2.55 — a 19.62x spread between two boxes that hold weapon skins and need the same key. Nothing about the contents explains that gap. Drop status does.
My Take: Trade the Filter, Not the Month
The seasonal calendar is not wrong. It is narrow. It describes items with real liquidity, and it gets quoted as if it applies to a catalog where most items do not have any.
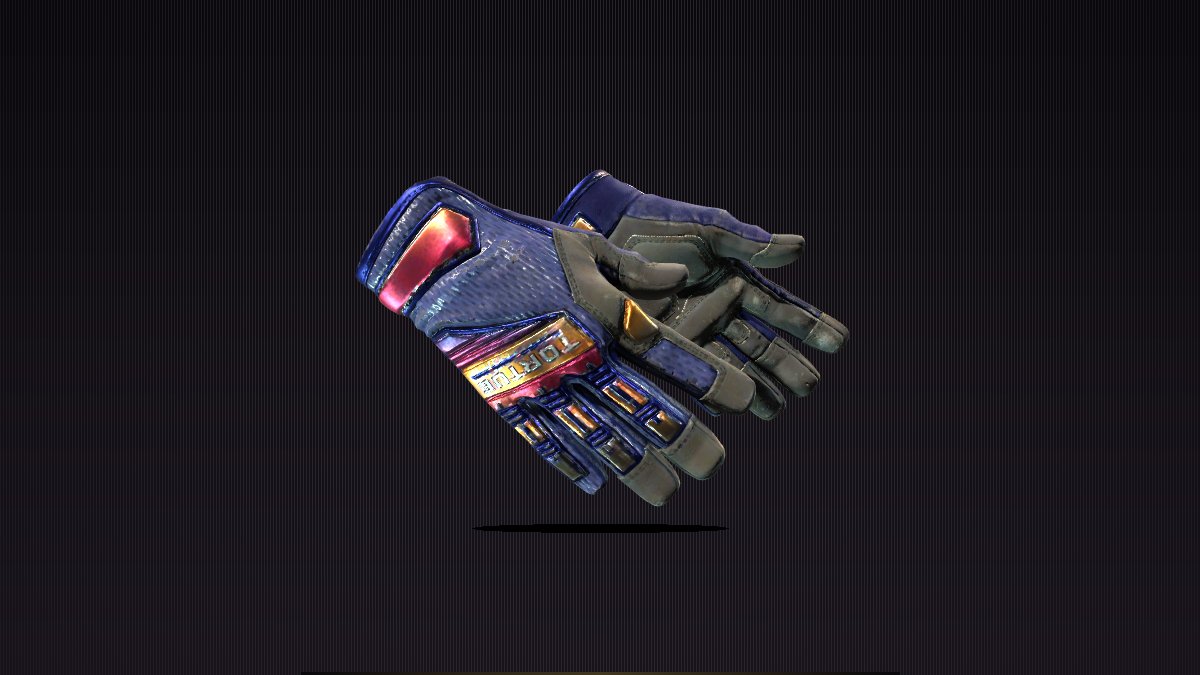
So use it that way. The filter that made the difference this week was a simple one: price floor plus a liquidity floor plus moderate depth. Run that screen over a 24-hour window and you get 1,047 qualifying items with a median move of +1.8% — the top of that list included a Berlin 2019 autograph up 30.5% at $7.40, a P250 | Cartel at $9.84 up 27.0%, and a UMP-45 | Momentum at $5.49 up 24.0%. That is what a September rally looks like when you insist on items someone will actually buy from you.
Run the same screen without the liquidity floor and the leaderboards become fiction. In the latest weekly prints, every item in both the top-five gainers and the top-five losers lists carried zero seven-day volume — a sticker "up" 3,410% and a 2015 capsule "down" 99.33%, both with no fills at all. Percentage changes without volume are not price discovery. They are one ask meeting a stale reference.
Three habits follow from that, and none of them require a forecast:
- Check daily sales before anything else. An item with hundreds of daily fills can fall 30% and still be tradable. A "gainer" with zero fills is not an opportunity, it is a data artifact.
- Sort by supply status, not by vibe. Discontinued containers have a supply curve that only shrinks. Active-pool containers have a faucet that runs every week. That single column explains more about a container's next two quarters than any seasonal chart.
- Let the volume leaders set your universe. The containers moving the most units in a seven-day window — 910,300 for Dreams & Nightmares, 713,800 for Kilowatt, 691,100 for Revolution, 423,900 for Fever — are the ones with a real bid underneath them. That is where attention actually converts into money.
Wrapping it up: September may well deliver the rally the calendar promises. It just will not deliver it to 38% of the catalog, and it will not deliver it to anything you cannot sell. If you want exposure to the busy season, take it through items with actual turnover — open a container like Violet Vortex if you want to chase a drop, or go straight to the marketplace and buy a finish that already has a sales history behind it. The month is a tailwind. Liquidity is the whole engine.