Half of CS2's Skin Market Is Now Knives — What the Index Doesn't Say Out Loud

Half of CS2's Skin Market Is Now Knives — What the Index Doesn't Say Out Loud
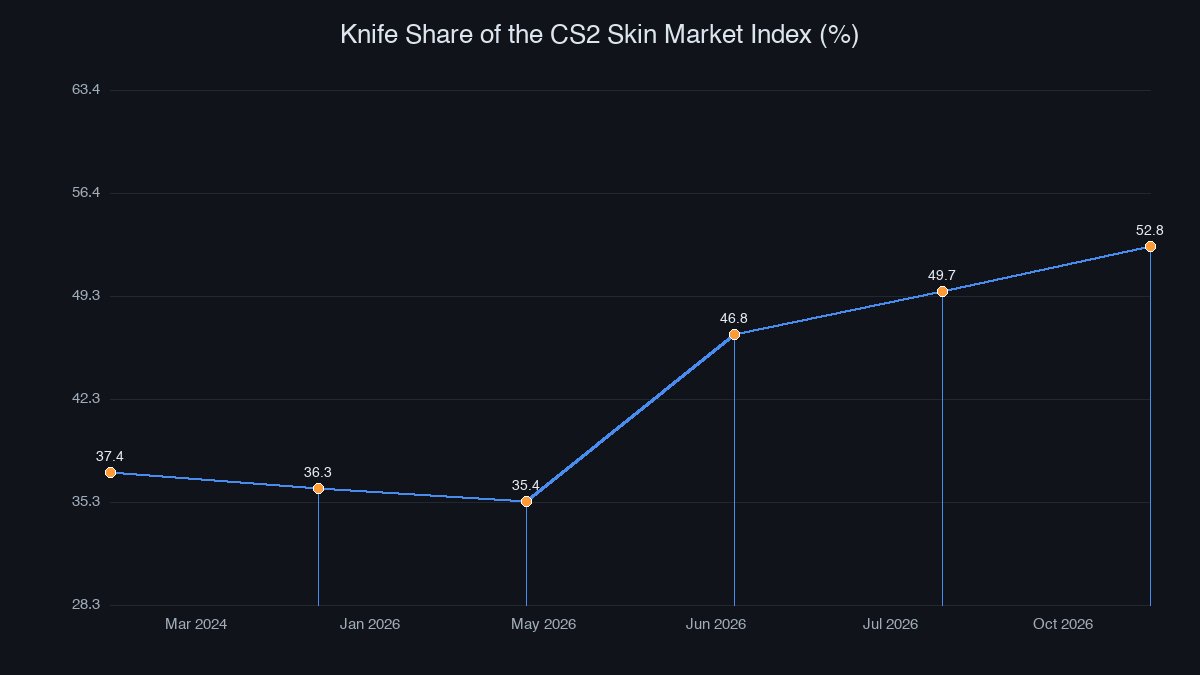
As of 5 October 2026, knives are 52.8% of the CS2 skin market's floor value. Weapon skins are 20.0%. Read those two numbers side by side and it looks like a stampede into knives — a segment that finally broke away from the game the market is named after.
Now read what actually happened between 15 May and 5 October 2026. The knife index moved from $1.91 million to $1.95 million, a gain of 1.8%. The weapons index moved from $2.22 million to $0.74 million, a loss of 66.8%. Knives did not take the lead. They stood still while the other half of the scale emptied out, and the share arithmetic did the rest.
The Crossover Nobody Announced
For most of the last three years knives and weapon skins traded the lead back and forth, and the gap was always narrow enough to be noise. In March 2024 it was 37.4% knives against 37.9% weapons. In January 2026 weapons were ahead comfortably, 42.6% to 36.3%. As late as 15 May 2026 weapons still led, 41.2% to 35.4%.
Then the pattern broke in a single week. On 22 May 2026 knives moved ahead and never gave the lead back. By 1 June the split was 41.5% to 34.4%. By 10 June it was 46.8% to 24.6% — a nine-point week for knives and a ten-point collapse for weapons at the same time. By 1 July knives sat at 49.7%, and since 8 August 2026 they have been above half the index every single day.
That is the shape of a repricing, not a trend. Trends take quarters. This took five weeks, which is what happens when one half of a market loses its bid while the other half simply stops trading.
Half the Market Didn't Rise — the Other Half Fell
Pull the two halves apart and the damage concentrates brutally. Over the same 15 May to 5 October window, the rifle index fell from $1.60 million to $0.52 million, down 67.3%. Heavy weapons lost 87.7%. Pistols fell 59.2%. SMGs were the mildest of the weapon categories at roughly 25% down, which tells you the pain was not about price tier — it was about everything that is not a knife.
Weapons did not bottom out either. The weapons index was still $0.85 million in mid-August and $0.74 million in early October. After the break the line kept drifting lower — a slow bleed rather than a crash and bounce.
Zoom out and the structural story is cleaner still. Since 15 August 2023, knives went from $1.22 million to $1.95 million, up 60%, and their share of the index climbed from 36.3% to 52.8%. Weapons went from $1.16 million to $0.74 million, down 36.6%, with their share falling from 34.7% to 20.0%. Stickers actually gained — $0.61 million to $0.76 million, up 23.8% — and now represent a bigger slice of the index (20.5%) than weapon skins do. Gloves lost ground: $0.36 million to $0.24 million, down 33.0%, share falling from 10.7% to 6.5%.
So of the four large categories, knives are the only one that clearly gained in three and a half years, stickers roughly held their place, and both gloves and weapons are worth less at the floor today than they were when the game was still called CS:GO.
Why the Trading Volume Tells a Different Story
Here is where most articles about this get it wrong. Value share and trading activity are two different measurements, and right now they point in opposite directions.
On Steam turnover for the most recent tracked week, rifles still led with 33.9% of trading value. Knives were second at 27.6%, up 1.4 percentage points — and their price index fell for an eleventh straight week, closing at a yearly low around 47.0 points. That is the tell. Knives are taking a bigger share of the money while their prices keep sliding, which is what a market with no price support looks like: more hands, lower bids.
The rest of the board for the same week was almost uniformly red. The overall index closed at 72.4, down 4.4%. Rifles sat at 99.5 (−4.3%), pistols 81.4 (−5.4%), stickers 19.4 (−5.0%), agents 160.1 (−4.4%), gloves 53.1 (−4.5%). Market breadth was the ugliest number of all: of 3,203 liquid items, only 18% rose while 72% fell.
Steam turnover for the week was about $10.9 million, up 6.9% against the month's average week — so money was moving, not leaving. An independent read on the same fortnight put it slightly differently: a skin index up 0.9% over seven days, with 268,200 confirmed sales split between Steam (181,800) and CSFloat (86,400). Zeus x27 had the strongest median gain at +2.6%; Specialist Gloves had the weakest at −3.2%. Breadth was still negative, 56% falling against 30% rising.
Two sources, two windows, one conclusion: this is a market where the average is being held up by a handful of categories while the median item quietly loses value. If your portfolio looks fine on an index chart and bad in your inventory, that is not a contradiction. It is the whole story.
What This Means If You Own Anything That Isn't a Knife
Three things follow from the data, and none of them require a prediction.
Liquidity is now concentrated. Knives are half the floor value of this market and the category with the largest share of Steam spend after rifles. When one segment carries that much of the value, its health becomes the market's health — and the knife index has been printing yearly lows, down more than 41% from its own high while holding an outsized share of trading volume.
The weapon-skin discount is historically extreme. A category that lost two thirds of its floor value in five months against a category that moved 1.8% is not a normal spread. It does not mean rifles are cheap, and it does not mean they are due for a bounce — the index kept drifting lower after the break. It means the two halves of this market are now priced by completely different buyers.
Watch the crossover points, not the headline. The two failures that mattered most on the latest board were both the kind you can find in thirty seconds of data: the share of liquid items falling jumped from 51.5% to 82.3%, and the knife index fell below its previous yearly low while keeping at least 27.6% of trading value. Both were published before the prices moved.
There is one more number worth keeping, because it is the one that survives every week of noise: the Steam-versus-marketplace spread. Across the hundred most popular items, Steam was 30% more expensive as a median. That gap is structural — Steam wallet funds cannot be withdrawn — and it is the single most reliable arbitrage fact in this economy. Where you buy matters more than when you buy.
If you want to see where the knife share actually shows up in prices rather than in a chart, browse the live marketplace and compare what the same finish costs against Steam. Half of this market is knives, more than a quarter of its trading value moves through knives, and the spread between venues is still the one edge nobody bothers to use.