CS2 Skin Market Down 9.4% in 30 Days: Where the Money Went

CS2 Skin Market Down 9.4% in 30 Days: Where the Money Went
On April 18, the SkinGrind 100 — an index that tracks the 100 most-traded CS2 items on Steam — closed at 6,328.23. By October 4 it sat at 4,694.38. That is a quarter of the index's value gone in under six months, and the last 30 days alone took 9.4% off the top.
If you hold a knife, a pair of gloves, or a case stack you bought earlier this year, you already felt this in your inventory value. What is harder to see is why it happened, and whether the drop is a dip to buy or the start of something longer. The numbers below are the difference between guessing and knowing.
The Raw Numbers
SkinGrind's index, which starts at 1,000 in February 2015 and weights items by Steam trade volume, gives us the cleanest single read on the market. As of October 3, 2026, it stood at 4,715.36. That is down 8.9% over 30 days, down 0.2% over 7 days, but still up 16.6% over a full year. Since inception it is up 371.5%.
Read those three timeframes together and the story changes. A 30-day slide inside a positive 12-month trend is a correction, not a collapse. The collapse already happened a year earlier — the index is still 25.5% below its April 18 high of 6,328.23.
The market-cap series tells the same story with bigger numbers. CSMarketCap put the total value of all CS2 skins at $8.71 billion on March 17, 2026, the peak of its series. On September 29 it read $5.81 billion. That is a 33.3% decline — roughly $2.9 billion of notional value removed from player inventories in six months.
One caveat worth stating plainly: every one of these figures is a third-party commercial estimate, not audited data published by Valve. They disagree with each other by a few percent. The direction, however, is consistent across all of them.
Nobody Escaped: All Six Categories Fell
In a normal correction, money rotates. Knives cool off while rifles pick up, or cases absorb the flow as players stop opening and start hoarding. That is not what the October data shows.
SkinGrind tracks six item-type indices — knives, gloves, rifles, pistols, cases and stickers — and all six fell over the same 30-day window. Pistols were the worst, down 16.7%. Cases, usually the most defensive corner of the market because they are cheap and consumable, went down with everything else.
The collection indices are even more telling. SkinGrind publishes an index for each of 80 collections. Over those 30 days, not one of the 80 rose. Not a single niche corner of the market was immune.
That pattern — everything down together, nothing rotating up — points away from sentiment and toward the supply side. Traders panic in rotation. Supply shocks hit uniformly.
The Volume Story Is the Scarier One
Price indices can be distorted by a handful of expensive items. Transaction counts cannot. And the volume series is the part of this market that has genuinely broken down.
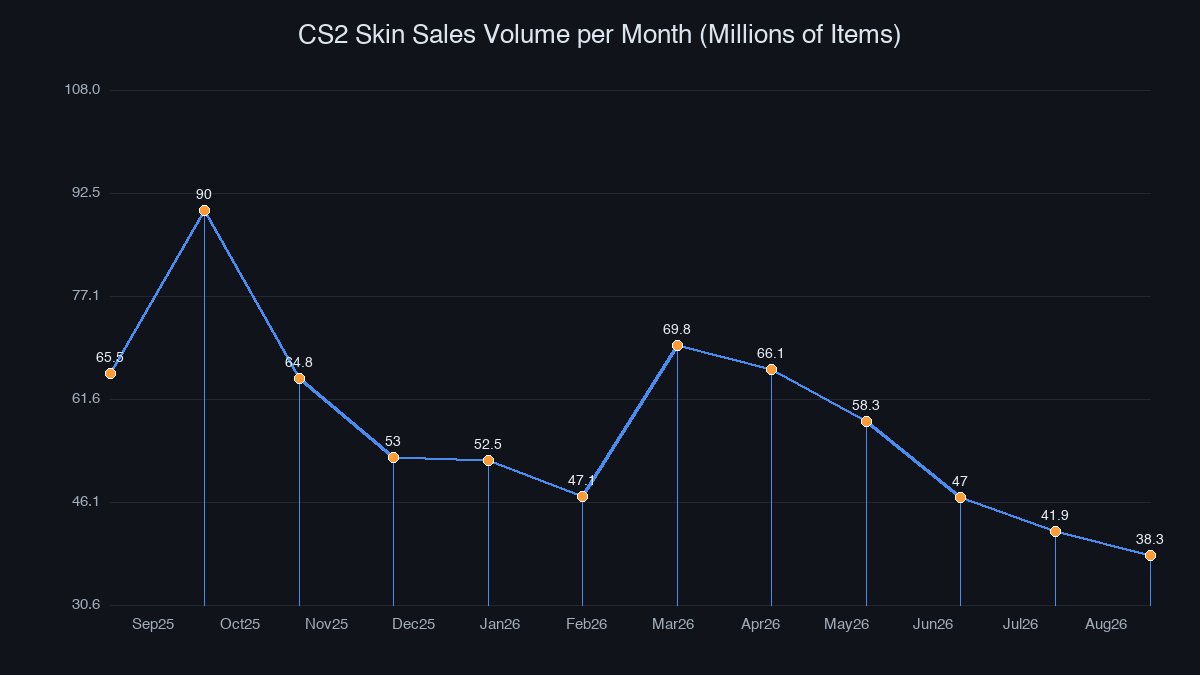
In October 2025, CS2 players traded 90.0 million items — the record month in the dataset, driven by the trade-up update that landed on the night of October 22. A year later, in August 2026, the same measure read 38.3 million. That is a 57% decline in monthly turnover.
Look at the shape of the curve rather than the endpoints. September 2025 was 65.5 million. October spiked to 90 million. Then November 64.8, December 53.0, January 52.5, February 47.1, March 69.8, April 66.1, May 58.3, June 47.0, July 41.9, August 38.3.
There are two bounces in there — March and April — and both faded. The trend line from February onward is almost straight down. A market where fewer items change hands each month is a market where the bid-ask spread widens, and wide spreads are what turn a 5% paper loss into a 15% realised one when you actually try to sell.
What Actually Broke
The root cause is not a bad update, a ban wave, or a competitor marketplace. It is a rule change that permanently expanded supply, and the market has been digesting it ever since.
On the night of October 22, 2025, Valve changed the Trade Up Contract so that five Covert (red) skins could be exchanged for a guaranteed knife or pair of gloves. Before that, knives and gloves entered the economy only through case openings, which meant a roughly 0.26% drop rate per open. After the change, the rarest tier in the game had a guaranteed, farmable production path — and Covert skins that used to cost $5 to $10 became raw material.
The reaction was immediate. Pricempire measured the market at nearly $6 billion before the update and $4.27 billion roughly 24 hours later, a 29% drop. A later snapshot showed a steeper fall from $6.08 billion to $3.08 billion over 38 hours. At the low point, market-cap trackers recorded a move from $8.63 billion to $4.81 billion — a 44.2% decline.
That was a year ago. The important part is what happened after: the market recovered, drifted up into a March 2026 peak, then began the slow slide we are measuring now. Supply expansion is a one-time shock, but its effect on the floor price of knives and gloves is permanent. The current downtrend is the market slowly repricing to the new production cost of its most expensive items.
There was an earlier warning shot, too. On July 15, 2025, Valve introduced Trade Protection — a seven-day window in which a completed trade can be reversed. Market cap fell 12.7% in six days, from $6.92 billion to $6.04 billion. Traders hate uncertainty about settlement more than they hate bad news, and both of these updates introduced exactly that.
Where the Money Went
Here is the uncomfortable answer: most of it did not go anywhere. It stopped existing.
When five Covert skins can be converted into a knife, the knife is no longer scarce in the way the market priced it. The value did not transfer to the Covert skins — those went up briefly and then normalised as supply of reds met demand. It did not move into cases, which fell along with everything else. It was written off, because the underlying asset became cheaper to produce.
That has a practical consequence for anyone holding inventory. If your thesis is "knives always go up because they are rare," the thesis was invalidated in October 2025. If your thesis is "this specific finish is genuinely hard to obtain and people want it for the look," that thesis survives, because a trade-up contract cannot produce a specific pattern or float.
Which is why the current correction is not uniform at the level that matters. Index-level numbers say everything is down 9%. Item-level numbers say the difference between a Factory New low-float Karambit and a Field-Tested Rust Coat is now much wider than it was, because the first is still gated by randomness and the second is gated by nothing.
The Smart Play
Three things are true at once right now, and they suggest different actions.
First, the 12-month trend is still positive at +16.6%, so this is not a dead market — it is a market working through a supply overhang. Second, monthly turnover has fallen for six of the last seven months, which means liquidity is the binding constraint, not price. Third, the categories that fell hardest — pistols at -16.7% — are the ones with the least differentiated supply, which is exactly what a production-cost repricing would predict.
Put together, that argues for buying things that cannot be manufactured on demand: specific floats, specific patterns, and containers whose supply Valve has already cut off. Chroma 3 at $2.55 versus Kilowatt at $0.13 is the cleanest illustration of the principle — a 19.6× price gap between two cases that hold similar-quality skins, driven entirely by whether the case still drops. The discontinued one costs 20 times more because nobody can farm more of it.
If you want to act on that rather than just read about it, the practical first step is to stop shopping by item name and start shopping by supply status. Browse the SkinVS marketplace with that filter in mind — check whether a finish can be trade-up produced before you pay a rarity premium for it, and check whether the container it came from still drops. The market has spent twelve months teaching that lesson at a cost of roughly $2.9 billion. You can learn it for free.
And if you still want the opening experience, keep it to a budget you would spend on a night out rather than an investment you would defend in an argument. Phantom Cache is a reasonable place to do that — cheap entry, real knife ceiling — as long as you go in knowing the published odds are 0.26% for the top tier and the expected return is negative by design.