CS2's Market Cap Is $5.1 Billion. Another Tracker Says $7.2 Billion. Both Are Defensible.

CS2's Market Cap Is $5.1 Billion. Another Tracker Says $7.2 Billion. Both Are Defensible.
Two price feeds, same game, same weekend, numbers that disagree by $2.06 billion. On August 31 the cs2.sh index put the tracked value of the CS2 item economy at $5.1 billion. Measured the same day, CS2Cap reported $5.464 billion. A third write-up summing up August landed on $7.16 billion. One industry overview is blunter still: it says estimates range from $6.7 to $8 billion, while acknowledging that other methodologies land as low as $3 to $4 billion.
Nobody is lying, and nobody fat-fingered a spreadsheet. Each number is the output of a different measurement decision, and the decisions compound. If you are using the headline market cap to decide whether the skin economy is heating up or cooling off, you are reading someone else's ruler and calling it yours.
The Raw Numbers
Start with what is actually being counted, because the catalogs are not the same size. cs2.sh prices 50,528 items across 131 collections, pulling quotes every few minutes from six marketplaces: BUFF, Youpin, CSFloat, Skinport, Steam and C5Game. CS2Cap covers 42,090 items across 41 marketplaces — a bigger venue list, an 8,438-item smaller catalog.
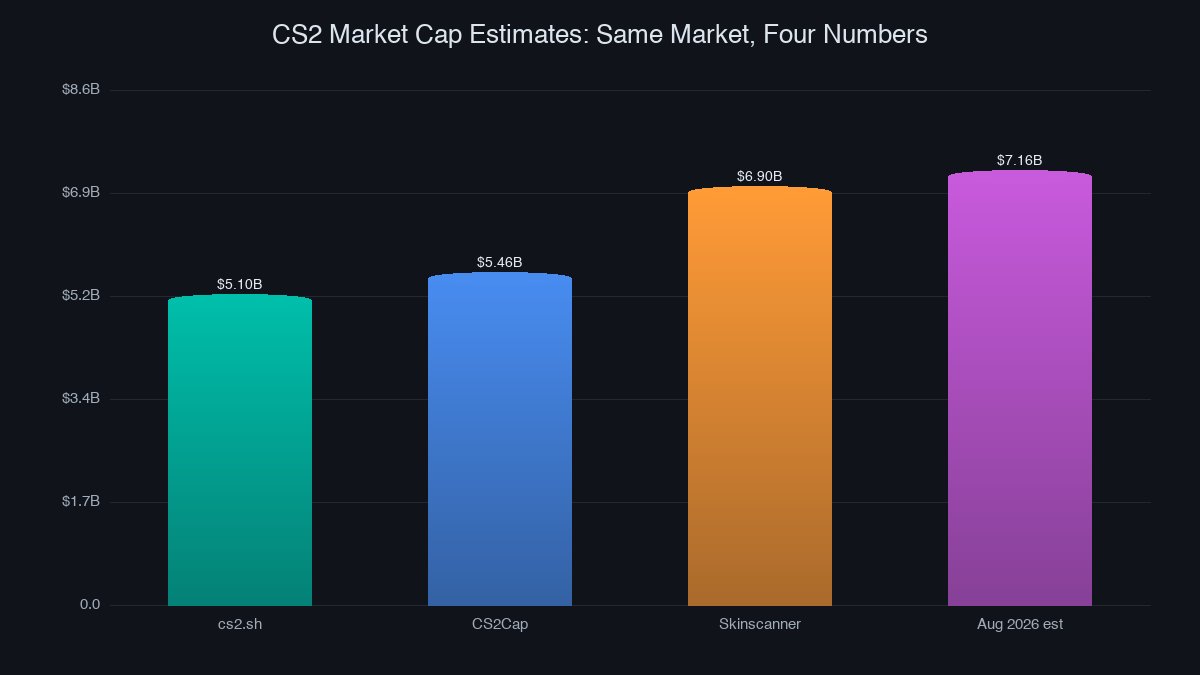
Then there is the metric itself. CS2Cap's headline is a capitalization: price multiplied by estimated supply, summed across the catalog. Its 24-hour change was +0.72%, seven days +1.32%, thirty days -2.84%, with $643.1 million of 24-hour volume denominated alongside it. SteamAnalyst takes a different route entirely: it records one reference price per item per day and reports the median. On its live board the median skin sits near $90, and the 90-day median index has gone from a base of 100 to 95 — a 5.0% decline with a range of just 94.4 to 100.
A capitalization and a median are not competing answers to the same question. One is a total; the other is the middle of a distribution. Quoted side by side in a headline, they look like a contradiction. They are two different instruments, like a thermometer and a barometer.
Where the $2 Billion Gap Comes From
The catalog is not the same catalog
Every tracker draws a boundary, and the boundary moves the total. TradeUpAcademy's weekly feed tracks 28,107 items and values that set at roughly $22.8 million — three orders of magnitude below the headline caps, because it is measuring one curated price feed, not an estimate of every copy in existence. Its composition table is the useful part: knives are 44.02% of tracked value, weapon skins 32.73%, cases 12.02%, gloves 5.01%, stickers 4.07%, agents 1.38%.
Now move the boundary. Include stickers, capsules and sealed containers, and you add roughly a fifth of the tracked catalog. Exclude anything below a dollar and you drop 38.25% of items instantly — the largest single block in the price distribution, and the block that has been falling hardest all year. Two trackers can therefore agree completely about the price of a Karambit and still publish totals a billion apart.
Price times supply is an estimate, not a fact
Valve does not publish item counts. Supply has to be inferred from listing depth, inventory scans and historical drop timing. Nudge the supply model for a single high-value category and the total moves by hundreds of millions, without a single price changing.
You can see how fragile that estimate is in the price distribution: 1.03% of tracked items sit above $1,000, and 5.31% sit between $200 and $1,000. Under 7% of the catalog carries most of the capitalization. A cap number is therefore a statement about a few thousand expensive items wrapped around a mass of cheap ones — and the expensive tail is exactly where the supply guesswork is hardest.
Composition decides the answer
The reference overviews make the same point from the other direction: about 27.9 million item owners holding somewhere near 975 million items, which works out to roughly 35 items per owner. Anyone valuing that population has to decide what an unlisted, illiquid, $0.20 Mil-Spec is worth. Multiply it at a market lowest-ask and you get one total. Multiply it at a notional floor value and you get another. Multiply it at zero, on the reasonable argument that most of it will never trade, and the headline falls by a large fraction.
What Surprised Us
The surprise is not the size of the gap. It is how stable the direction is underneath it.
Every feed agrees the market fell hard in late October 2025, when the trade-up contract started accepting five Covert skins for a guaranteed knife or gloves. One tracker logged the crash from $6.27 billion to $3.18 billion in 48 hours; another recorded the low at $4.27 billion with knife and glove prices down 40% to 60%. Every feed also agrees it recovered: $4.83 billion by the end of October, "above $5 billion" through the winter, and back to roughly 75% to 80% of pre-crash levels by early 2026.
The disagreement sits entirely in the middle of that path — and it is not symmetric noise. It is a measurement of a market whose mass has been redistributing. Portfolio values moved out of knives and into the Covert skins that became crafting inputs. Any tracker whose universe weights knives heavily will now print a lower number than one that weights the rest of the catalog the same way.
Which is why the flat-looking tape matters more than the cap. Ask the same week what actually happened and the answer is unambiguous: 40% of tracked skins rose, 46% fell, with 4.2K up against 4.8K down — and those moves sat on 298,600 confirmed sales in seven days, 200,600 of them on Steam and 97,900 on CSFloat. Those are real fills. You can verify them by looking at any listing's sale history.
The Smart Play
Stop quoting market caps as if they were a price. Use the number that matches the decision in front of you.
- For direction, use a median index. It is not sensitive to supply guesswork, and it cannot be dragged around by one rare item. Down 5% over 90 days is a usable fact; "the market is worth $7.2 billion" is not.
- For a specific item, use its own listing ladder across two or three venues. That is the only price you can actually transact at.
- For breadth, count gainers against losers. A 1.58-to-1 ratio of declining to rising references tells you more about the week than any total.
- For inventory risk, use the composition table. If knives are 44% of tracked value, then a knife-heavy inventory is not a diversified bet on CS2 — it is a concentrated position in one category.
The professional-scene data is the cleanest illustration of the last point. Across 578 recorded pro loadouts holding 1,015 tracked skins, the total active loadout value is $3,796,806 — about $6,569 per player. That is not small money, but it is far below what the cap headlines imply a serious collection "should" be worth, because pros hold a narrow set of liquid, recognizable finishes rather than a broad index of the catalog.
That is the practical version of the $2 billion gap. A broad cap number is a curiosity; a tight, liquid, verifiable position is a strategy. If you want to build one, the cheap way in is a container whose contents you actually understand — start with something like the Fan Favorite case, then check each outcome's real sale volume before you commit. And if you would rather skip the randomness entirely, browse the SkinVS marketplace and buy the exact finish you want, at the price the order book says it costs. The catalog is bigger than ever. Your reading of it does not have to be.