CS2's Two Market Trackers Disagree by $400 Million. Both of Them Are Right.
CS2's Two Market Trackers Disagree by $400 Million. Both of Them Are Right.
Two numbers, eleven days apart, same market. On October 6, Betrefs valued every CS2 skin in existence at $4.71 billion, down 0.6% on the day. On October 19, cs2.sh put the same economy at $4.3 billion. Subtract one from the other and you get a $410 million hole, an 8.7% collapse, and a headline.
That subtraction is also wrong — and understanding why is more useful than the headline.
This is an argument, so let me state it plainly: CS2's skin economy is not crashing. It is thinning. Prices at the floor are melting across the middle of the catalog, supply is piling up in listings, and the categories that look healthy are healthy for structural reasons that have nothing to do with demand. Anyone reading the market through one index number is going to be wrong in one direction or the other.
Two Numbers, Two Different Measurements
Betrefs counts supply against price: 1,148,798,565 skins across 16,860 items, each multiplied by its cheapest current price across major marketplaces, then summed. That is a stock measurement. It answers "what would every item be worth if it all sold at today's lowest ask," which nobody is doing.
cs2.sh counts 50,530 items in 131 collections across six venues — BUFF, Youpin, CSFloat, Skinport, Steam and C5Game — and reports the same kind of aggregate alongside its Broad Market Index, currently 634.1 against a January 2024 base of 1,000. That is a flow-weighted ask measurement. It answers "where are sellers actually sitting."
Both are legitimate. Neither is the market. Comparing them directly is like weighing a suitcase and then reading a thermometer.
What the two do agree on is direction, and that is where the real information is:
- cs2.sh's broad index: down 1.6% over 7 days and 5.8% over 30 days as of October 15.
- On a $4.3 billion base, 5.8% is roughly $249 million of notional value removed in a month.
- Gamezod's separate index sits at 72.7, down 0.81% on the week and 5.13% on the month — its lowest reading since the index began, against a March 2025 high of 116.31. That is 37.5% off the peak.
- SteamAnalyst's index: 847.14, down 0.5% on the day.
Four independent trackers, four different levels, one shared conclusion: mildly down, steadily, for months. Nobody's data supports "crash." Nobody's data supports "recovery" either.
The Case for "Nothing Is Wrong Here"
Start with the strongest bullish evidence, because it is genuinely strong. CSMarketCap's category indexes, measured from May 15 to October 5, 2026, show knives holding — and holding share in a way that is hard to fake.
In March 2023, knives were 36.3% of total category value and weapon skins were 34.7% — a dead heat. By October 5, 2026, knives were 52.8% and weapon skins were 20.0%. More than half the floor-value of the entire market now sits in one category, and it is not the one with the guns in it.
Stickers went the other way in the good direction: up 23.8% over the same window, with their share of category value climbing from 18.2% to 20.5%. Shotguns, per Gamezod, sit at 104.2 on an index that starts at 100 — the only weapon category above its baseline. Machine guns were the only category to gain on the week at +0.11%.
Knife supply is structurally fixed in a way rifle supply is not. You cannot open a case and print more of a specific knife finish at will; the drop rate is 0.26% for any gold item at all, and the trade-up contract route consumes five Covert skins per knife. That is a supply wall that rifles do not have — a rifle skin can be reprinted by the thousand every time a case stays in drop rotation.
If you only looked at those numbers, you would conclude the market is rotating, not dying.
The Case for "Something Is Very Wrong"
Now the other half. The same CSMarketCap dataset, same dates, shows the middle of the market in freefall.
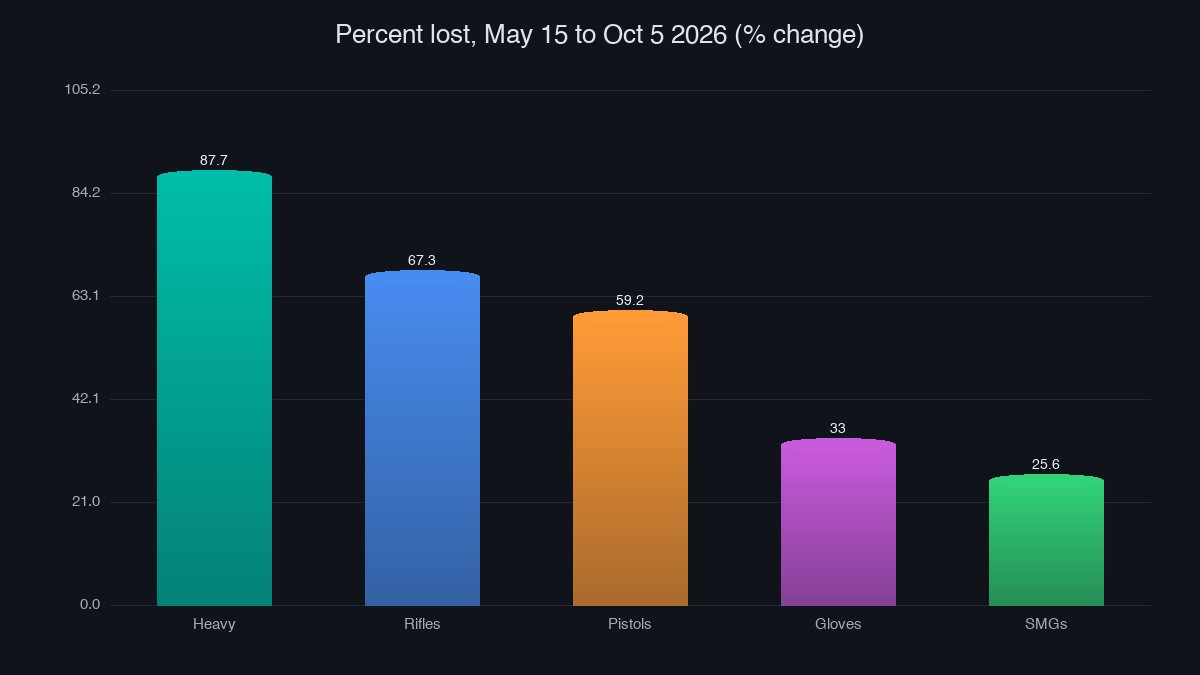
- Rifles: down 67.3% — and this is not a coverage artifact. CSMarketCap tracked 3,348 rifle items on May 15 and 3,349 on October 5. Same rifles, two-thirds less value at the floor.
- Heavy weapons: down 87.7%. Effectively a write-off as a category.
- Pistols: down 59.2%. Gloves: down 33.0%. SMGs: down 25.6%.
Then look at the knife category through a different lens. Tradeit.gg's knife index reads 80.97, up 15.13 points on the day and 7.7% on the week — and then down 41.18% over 30 days and 39.15% over the quarter. Its knife market cap sits at $94.98 million, down 48.67% on the month across 4,310 items. Gamezod, meanwhile, has knives at 42.7, down 4.20% on 30 days.
Three trackers, three completely different knife stories: knives up in share, knives down 41% in a month, knives down 4% in a month. They are not lying to each other. They are measuring different slices — Tradeit is pricing the tradable float on its own venue, CSMarketCap is pricing a fixed basket of variants, Gamezod is pricing one copy of each of 40 widely listed knives.
And here is the number that worries me more than any price index: new listings up 30.0% in 24 hours, to 424,000, per SteamAnalyst. Listing volume in dollar terms fell 4.0% to $1.02 million while the count rose 30%. More items, less money behind them. That is the signature of people giving up on holding and trying to exit, not of a healthy market finding a floor.
Trade count tells the same story from the other side: roughly 1.0 million trades in 24 hours, down 6.0%, against $3.88 million in volume, down 0.4%. Fewer hands, same money. Concentration.
Where Both Sides Are Right
Here is my read, and it explains every number above without needing any of them to be wrong.
CS2's market has split into three tiers that no longer move together.
The top — knives, high-end gloves, the collector Covert skins — is a scarcity market. Supply is fixed by drop rates and case rotations. It holds share because there is nothing to dilute it with. It also trades in tiny volumes, which is why three trackers can disagree by 40 percentage points on the same category: a handful of transactions sets the price.
The middle — mid-tier rifles, most gloves, pistols — is where the damage is. These are the items that get reprinted every case rotation, that every player owns three of, and that have no scarcity story. Down 59% to 88% at the floor over five months is what happens when supply grows and the buyer pool does not.
The bottom — cheap cases, cheap stickers, play skins — is fine, because it is consumption rather than investment. People still open cases. Stickers still get applied and destroyed.
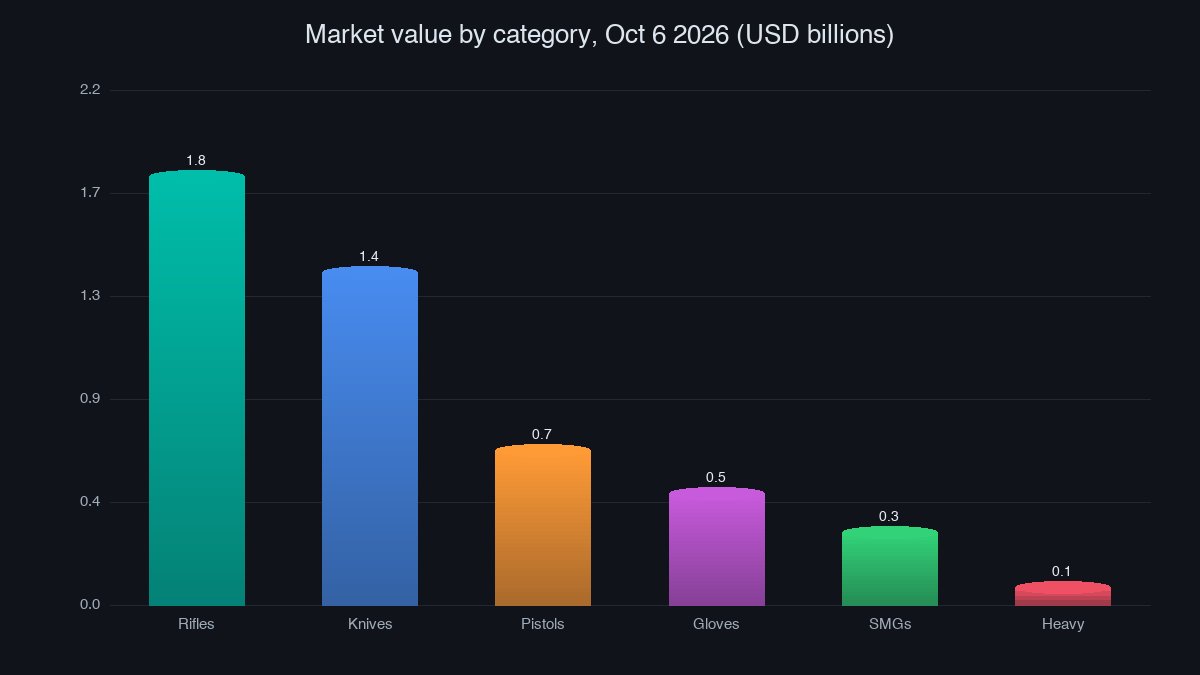
Notice the tension in that chart versus the share numbers above. By total market value on October 6, rifles were still the largest category at $1.8 billion, ahead of knives at $1.4 billion, with pistols at $653 million and gloves at $473 million. By floor-value share, knives were 52.8% and weapons 20.0%.
Both true. Rifles are worth more in aggregate because there are millions of them; knives dominate the floor because they are worth more per item. When a market's aggregate value sits in the high-volume, low-margin tier while its floor value sits in the low-volume, high-margin tier, price indexes stop describing the same thing. That is exactly where CS2 is right now.
What I'd Watch Instead of the Headline
Three signals, in order of usefulness:
- New listing count versus listing value. 424,000 listings against $1.02 million is an average ask of about $2.40. If the count keeps climbing while dollar value falls, supply pressure is still building regardless of what the price index says.
- Trade count. One million trades a day against a 29.6-million-owner base and 1.11 billion skins outstanding works out to about 3.4 trades per hundred owners daily — and trade count is falling while the owner base is not. Price is the last thing to break in a market like this; participation breaks first.
- Player count against inventory. 650,000 in-game now, a 1.1 million peak today, 751,000 average over 24 hours, 1.3 million month peak — against 37.7 items owned per account. If hours hold while listings climb, the selling is discretionary. If hours fall and listings climb, it is not.
None of that is a crash call. It is a liquidity call, which is a much less dramatic and much more tradeable conclusion. Thin markets do not fall in straight lines — they gap, and then they sit.
If you want to watch the split yourself instead of reading one index number, the SkinVS shop shows per-item floors across the whole catalog — compare a mid-tier rifle against a knife floor on the same screen and the two-tier structure becomes obvious in about thirty seconds. For the other side of the ledger, the trade page is where fixed-supply items actually change hands, and where thin volume shows up as wide spreads rather than falling prices.
The market is not down 8.7%. It is down, unevenly, in a way that rewards knowing which tier you are standing in.