The CS2 Market Fell for Seven Weeks. The Selling Already Stopped.

The CS2 Market Fell for Seven Weeks. The Selling Already Stopped.
The Caseway index closed the week of October 19 at 70.3 points. That is 0.1 points above its yearly low and 42.8% below the November peak. On a chart, it looks like a market in freefall. On the tape, it looks like a market that ran out of sellers.
Those two readings have been pointing in opposite directions for about two weeks now. This is the argument I want to make: the decline is real, the damage is real, but the panic phase is already behind us — and the people still waiting for a crash are reading the index instead of the transactions.
The Bear Case Writes Itself
Start with everything that is genuinely broken. The market has now declined for seven consecutive weeks. Week 41 was the worst single week in three months, with the broad index losing 6.1% and 82.3% of liquid items falling. Gloves dropped 5.6% that week and set a yearly low for the first time.
The high end, which held up longest, has now cracked too. After 12 straight weeks of declines, knives hit their lowest point in a year during the week of October 19. Gloves sit 46.6% below their peak. For most of this year, the premium segment was the reason people said the market was "fine underneath." That excuse is gone.
Weekly turnover tells the same story from the other side: $9.9M in the week of October 19, down from $16.7M in the first week of October. Less money changing hands at lower prices is the definition of a market losing confidence.
Read the Breadth, Not the Headline Index
Here is where the story splits. An index weighted toward expensive items will keep falling long after the average item has stopped moving, because the index is being dragged by a handful of high-value names that are repricing slowly.
Look at the breadth instead. In the week of October 17 to 24, P2Trades compared 294 skins and found a median change of exactly zero — for the second week running. But the count underneath flipped hard: 121 risers against 36 fallers, with pistols carrying the lean. The week before, the same sample showed 86 fallers against 52 risers. The week before that, 133 fallers against 9 risers.
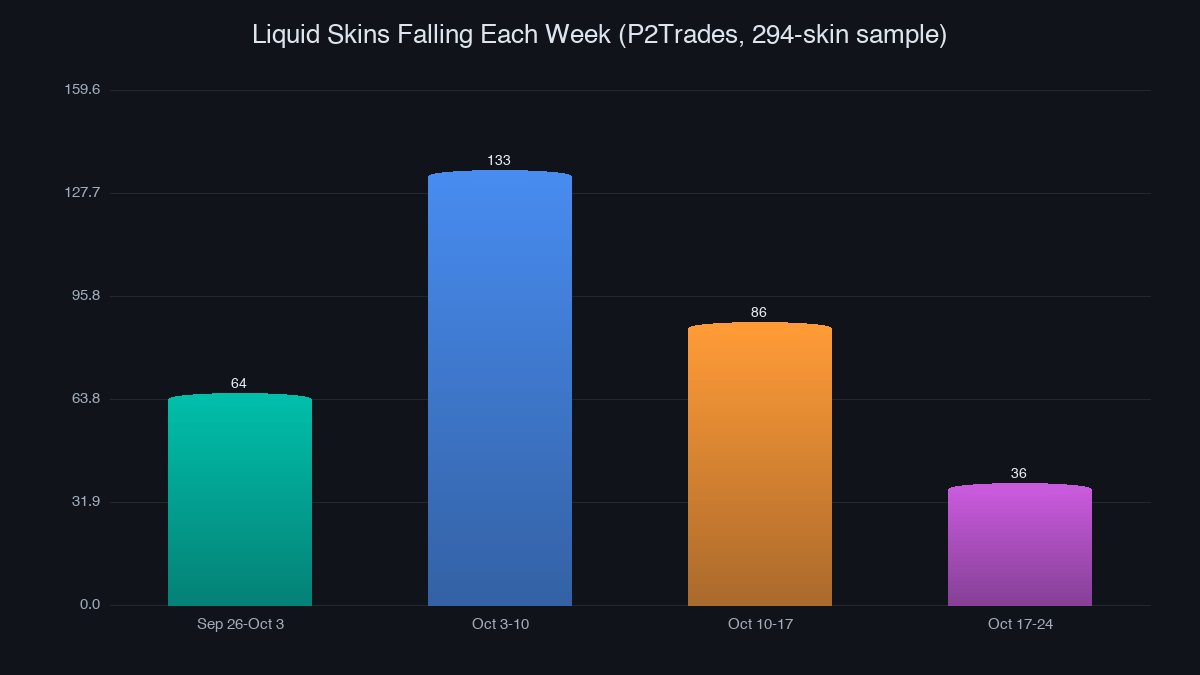
That progression is the whole argument. Falling items went 133, then 86, then 36. Rising items went from near-nothing to a clear majority. The index is still making new lows because the knife and glove segment — which is 46% of tracked catalog value — is doing the falling. Everything else already turned.
Caseway's own weekly note admits the shift in a single line: prices fell for 48.8% of liquid items, down from 57.7% the week before. When more than half the market is green while the headline is red, you are not watching a crash. You are watching a rotation.
Knives Are the Story Nobody Wants to Hear
Why are knives leading the decline? Because they were the last thing to rise. Through most of the last year, knives absorbed speculative money that should have gone into liquid mid-tier skins. A knife is easy to hold and hard to sell — thin books, wide spreads, and buyers who negotiate. When money gets nervous, the first thing it sells is the thing that takes three weeks to sell.
The numbers on selling behaviour support that. Dreams & Nightmares Case moved 889.7k units in seven days at $1.43 for roughly $1.28M in turnover — the single most traded item on Steam by both units and value. Meanwhile the expensive cases barely trade: Operation Breakout Weapon Case did 17.6k units in the same window. Cheap, liquid, instantly resellable items are where the volume went. That is not what capitulation looks like. That is what repositioning looks like.
There is one more signal buried in the same dataset. The median StatTrak premium rose to 31.15% from 29.63% week over week — up 1.52 percentage points while the overall catalog value went essentially nowhere at $22.71M, up 0.33%. Buyers were not leaving. They were moving down the risk curve into scarcity premiums, where a SCAR-20 | Crimson Web in Factory New costs $24.97 normal against $269.70 in StatTrak — a 980% premium for the same finish.
Where the Floor Actually Sits
It helps to know what this market is made of before arguing about where it stops. Of 28,107 tracked items, 35.46% are priced under a dollar and another 29.92% sit between one and ten dollars. Two thirds of the catalog is under $10. The expensive tail — the 1.02% above $1,000 — is what moves indices and what fills headlines, but it is not what most people actually buy and sell.
That composition explains the turnover figure. Across tracked marketplaces, total listed value sits around $827M against roughly $4.27M of daily turnover — about 0.52% of the book changing hands per day. A market that turns over half a percent a day cannot crash in a week. It can only drift, and drift is exactly what the last two weeks of breadth data describe: prices flat at the median while the expensive names slowly reprice downward.
If you are looking for a floor, this is where to look for it. Not at the knife that fell 40%, but at the median item in a 300-skin sample that has now printed zero change two weeks in a row. A flat median with improving breadth is the closest thing this market has to a bottom signal.
What Would Have to Be True for Me to Be Wrong
Three things would flip this read, and you should watch for all three.
First, breadth has to break again. If next week's sample shows fallers back above 100 in a 300-skin comparison, the October bottom was a head fake and the seventh week was not the last one. One good week is noise; two is a trend.
Second, the knife segment has to keep making new lows on rising volume. Right now knives are falling on thin, shrinking turnover — that is price discovery, not distribution. If knife volume expands while prices fall, the high end is being dumped and the whole thesis is wrong.
Third, the premium tiers have to stop narrowing. StatTrak and Factory New pricing is the market's risk appetite in a single number. If the median premium reverses below 29%, buyers are running from scarcity, not toward it.
The Line Between Panic and Price
The uncomfortable part of this argument is that "the selling stopped" does not mean "prices go up." A market can stop falling and sit at a yearly low for months. Liquidity is still thin, the spread between the cheapest and most expensive cash marketplace is still wide enough to eat an entire trade, and the $827M of listed value across tracked marketplaces is not the same thing as $827M of demand.
What it does mean is that the decision has changed shape. Six weeks ago the question was whether to sell before it got worse. Now the question is which segment you want to own when the rotation finishes — because the rotation is already visible in the data, even though the index has not caught up.
If you want to own the liquid end of that rotation, the cheap cases are where the volume actually is: Phantom Cache and its neighbours trade in the same bracket as the cases that carried 889k units in a week, which means you can get out of them without waiting for a buyer to appear. If you want the scarcity end, the StatTrak premium is the number to watch — it has been widening for two weeks, and it is the cleanest measure of whether the market's risk appetite is genuinely coming back.
Seven weeks of red is a fact. It is also, as of this week, a fact about fewer than half the items on the board. The index will tell you where the expensive stuff went. The breadth numbers tell you where the money went next.