CS2's Market Isn't Crashing. It's Splitting in Two.

CS2's Market Isn't Crashing. It's Splitting in Two.
The headline number is $5.4 billion, down 9.9% in thirty days and roughly 38% below the recorded peak of $8.71 billion. Read that alone and the story writes itself: CS2 skins are dying.
Then sort the same market by price and it stops looking like one market. Items under $50 lost a median 14.7% in the thirty days to October 13. Items at $1,000 and above lost 4.7%. Same window, same source, a threefold difference.
That is not a crash. That is a barbell — and the two ends are being driven by completely different forces.
The Bear Case Is Real
Let's not soften it. The damage is broad and it is documented.
CSMarketCap put the tracked market near $5.87 billion at the end of September, falling to about $5.4 billion by October 20 — down 20.3% over ninety days. SkinWise compared 22,734 variants between October 1 and October 23 and found a median move of -2.8%, with 14,754 falling against 7,009 rising. A narrower 55-item feed on CSFloat recorded 53 of 55 items cheaper between September 13 and October 13, median -7.4%, with 21 items down more than 10%.
The structural cause is not sentiment. In October 2025, Valve expanded Trade Up Contracts so five Covert skins can be exchanged for a knife or gloves. Before that, knives and gloves came almost entirely from the rare special slot in cases or from buying them outright. Overnight, a new supply channel opened, and it does not close.
Every case opened since then feeds it. Steam moved 889,700 Dreams & Nightmares Cases in seven days at $1.43, alongside 595,700 Revolution Cases and 554,000 Kilowatt Cases. That is an industrial-scale flow of Covert inputs into a contract that outputs knives. Downward pressure on the knife end of the market is now a permanent feature, not a panic that fades.
The week-by-week breakdown confirms it is a category effect, not a handful of bad names. Across 248 skins tracked between October 3 and October 10, the median moved -2.7%, with 133 falling against 9 rising and 106 flat. Rifles were the weakest group at -3.7% — 49 fallers against 4 risers out of 85 items — and pistols followed at -2.7%. Knives lost less, at -1.4%, and heavy weapons were flat. When whole categories move as a block rather than a few names moving alone, the cause is structural, not sentimental.
The Bull Case Is Hiding in the Same Numbers
Here is the part the crash narrative skips. Sort that same 55-item feed by price level and the decline collapses as price rises.
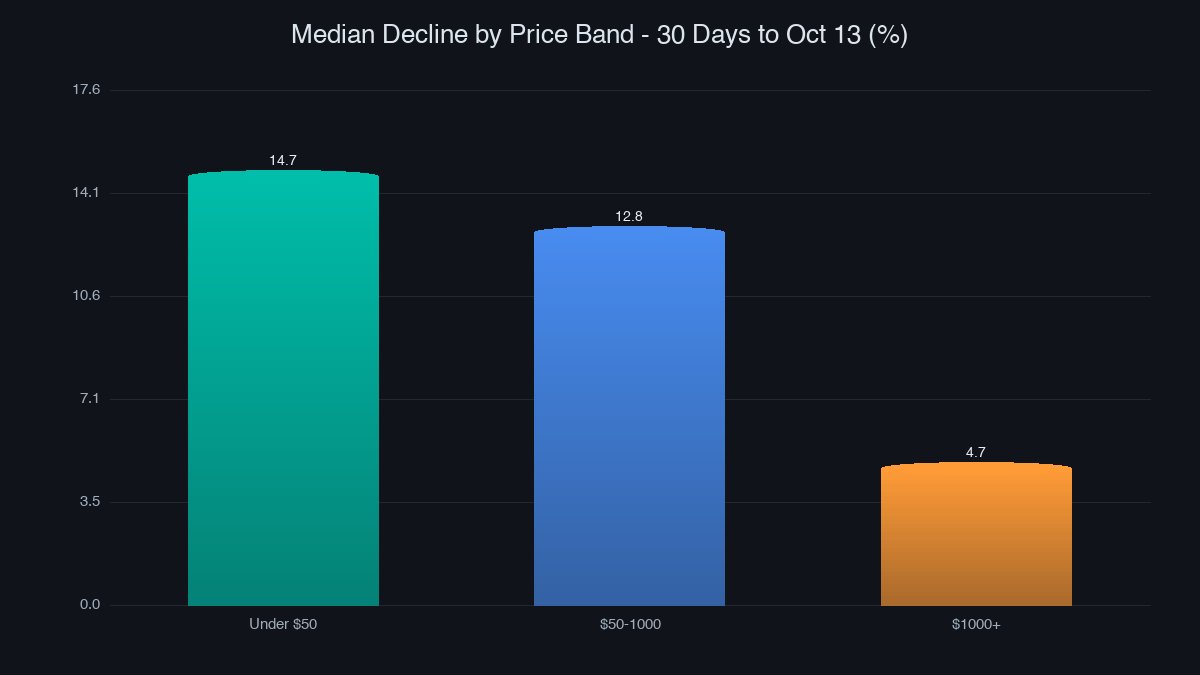
Under $50: median -14.7%, with one riser. Fifty to a thousand dollars: -12.8%. A thousand and up: -4.7%. The same report notes the top band is only ten items, mostly Dragon Lores and knives, so a single quiet listing can move its median — but the ordering held in August too, and the gap widened.
The only two genuine risers in that feed were both expensive and both small: the M4A4 | Asiimov (Well-Worn) from $116.00 to $120.68, and a Souvenir AWP | Dragon Lore (Field-Tested) from $5,799.93 to $5,951.63. Two out of 55 is a weak bull case on its own. What makes it interesting is what the two items have in common: they cannot be manufactured by a contract.
The breadth data agrees that the fall has stalled. veriloot's index gained 0.2% on October 17, with 38% of items up against 35% down — the first day in weeks where risers outnumbered fallers. Its seven-day figure was still -4.3%, but the daily direction flipped. And TradeUp Academy's catalog, tracking 28,107 items, rose 2.03% week over week to an estimated $22.66 million.
Notice the sample-size problem hiding inside those numbers. A 22,734-variant median moved -2.8%. A 55-item median moved -7.4%. Same market, same month, wildly different severity — because one sample is dominated by the long tail of cheap skins and the other is hand-picked. Headline severity depends almost entirely on which items a tracker chose to watch.
The Riser Trap Nobody Checks
If you are going to read market data, read the method too. Two of October's most-quoted "winners" were artifacts.
The Karambit | Fade (Minimal Wear) appeared to gain 32.6%. What actually happened: on September 13 the cheapest listing was on CSFloat at $1,900. By October 13, CSFloat had no listing at all — the feed only returned market.csgo at $2,520, a venue that had it at $2,800 a month earlier. The one venue comparable across both dates got 10% cheaper. The "gain" was a floor venue disappearing.
Same story with the USP-S | Cortex (Field-Tested) at +33.6%: the September floor was a $2.35 Skinport listing, Skinport left the feed, and CSFloat — present both times — moved from $3.36 to $3.14, a 6.5% fall.
This is the single most common error in CS2 market writing, and it is not limited to small trackers. SkinWise's October riser table is topped by "Sticker Slab" entries showing gains of +669,105% and +130,050% — one went from $22.39 to $149,835. No skin appreciated six hundred thousand percent. That is a listing error being published as a price move.
When you see a triple-digit gain, the first question is never "what happened?" It is "which venue vanished?"
My Take: A Barbell, Not a Crash
Both cases are correct, and that is the point. This market is no longer one thing.
The bottom end — sub-$50, high-supply, contract-manufacturable — is in a real, structural bear market. Its supply increases every time someone opens a $0.13 Kilowatt Case, and nothing in the system removes that supply at the same rate. Buying there and waiting for a recovery is buying into the mechanism that caused the decline.
The top end — grails, souvenir items, low-supply finishes with no contract path — behaves like a different asset. Its median moved -4.7% while the cheap end lost three times that. Its buyers are not checking prices daily; they are not forced sellers when an index dips.
What changed in October is not demand for skins. It is where the supply comes from. Contracts manufacture knives from red skins, so the price of a knife is now partly the price of five cheap Coverts — and the market has spent a year repricing that relationship.
You can watch that repricing in the catalog composition. TradeUp Academy's tracked catalog shifted its sticker share of total value from 4.01% to 6.2% in a single week while knives slipped from 46.05% to 45.18% of catalog value. Stickers have no contract path at all — you cannot manufacture a Katowice foil by feeding five cheap items into a machine. The slice of the market that cannot be printed is the slice gaining share.
Practically, three things follow. Buy above the $50 band where the floor is stickier. Treat any sub-$50 Covert as contract input with a built-in expiry, not as an investment. And check venue share before believing a spread — Buff163 was the cheapest venue for 37.31% of tracked items in week 43, up 7.84 points, while DMarket fell from 26.7% to 14.21%. The cheapest place to buy is a moving target, and the move is usually faster than the price.
If you want to see where the floor actually sits rather than where a tracker says it sits, the Fan Favorite case gives you a cheap, liquid entry point to watch the Covert-to-knife chain in action, and the SkinVS marketplace shows live asks across the bands instead of a monthly median.
A market that falls 38% from its peak and still holds its top end steady is not collapsing. It is separating. The people who lose money here will be the ones who bought the average and got the bottom.