CS2's Skin Market Just Posted Its Fifth Straight Down Week — Here's What's Still Moving
CS2's Skin Market Just Posted Its Fifth Straight Down Week — Here's What's Still Moving
On October 18, the Caseway market index closed at 71.3, down another 1.7% on the week. That is the fifth consecutive weekly decline, and it follows a stretch that already looked bad: the week before, the same index lost 6.1% and closed at a yearly low of 74.7 — its worst seven days in twelve weeks.
Here is the strange part. On the same day that benchmark hit a fresh low, more than 44,000 Revolution Cases changed hands at 14 cents each. The market is not dead. It has simply split into two very different halves: a cheap, high-volume floor where people keep opening containers, and an expensive top end where almost nothing is clearing.
If you are holding skins and wondering whether to sell, wait, or buy the dip, the data below is what should drive that decision. Not the headlines.
The Numbers Behind the Slide
Two independent trackers agree on the direction and disagree on the size, which is worth understanding before you quote either one.
Caseway, which prices a fixed basket of liquid items on a daily basis, shows a market that fell 6.1% in the week to October 11 and then another 1.7% in the week to October 18. In that first week, the share of declining liquid items jumped from 51.5% to 82.3% — meaning four out of five things you could actually sell were worth less than they were seven days earlier. Today the split is 27% rising, 58% falling across 3,197 liquid items, with Steam turnover for the week at $14.4 million.
The broader "$4 billion market" numbers floating around need a caveat. cs2.sh values its tracked catalogue at $4.3 billion across 50,530 items in 131 collections, with its Broad Market Index at 631.7 against a base of 1,000 set in January 2024, down 1.8% over seven days. StrikePot's snapshot from October 15, built on a different provider, puts tracked value at $4.746 billion across 46,139 items, with a 7-day change of −4.62% and a 30-day change of −11.59%.
Those totals are not comparable — different catalogues, different supply estimates, different inclusion rules. What they agree on is the trend: roughly 1.8% to 4.6% down in a week, and double digits down over a month.
Not Every Category Is Bleeding Equally
SteamDB's 27-day comparison, covering snapshots from September 20 and October 18 with 17,486 qualifying listing variants, is the cleanest category breakdown available right now. The median item fell 6.2%. But the spread between categories is wide, and it tells you where the pain is concentrated.
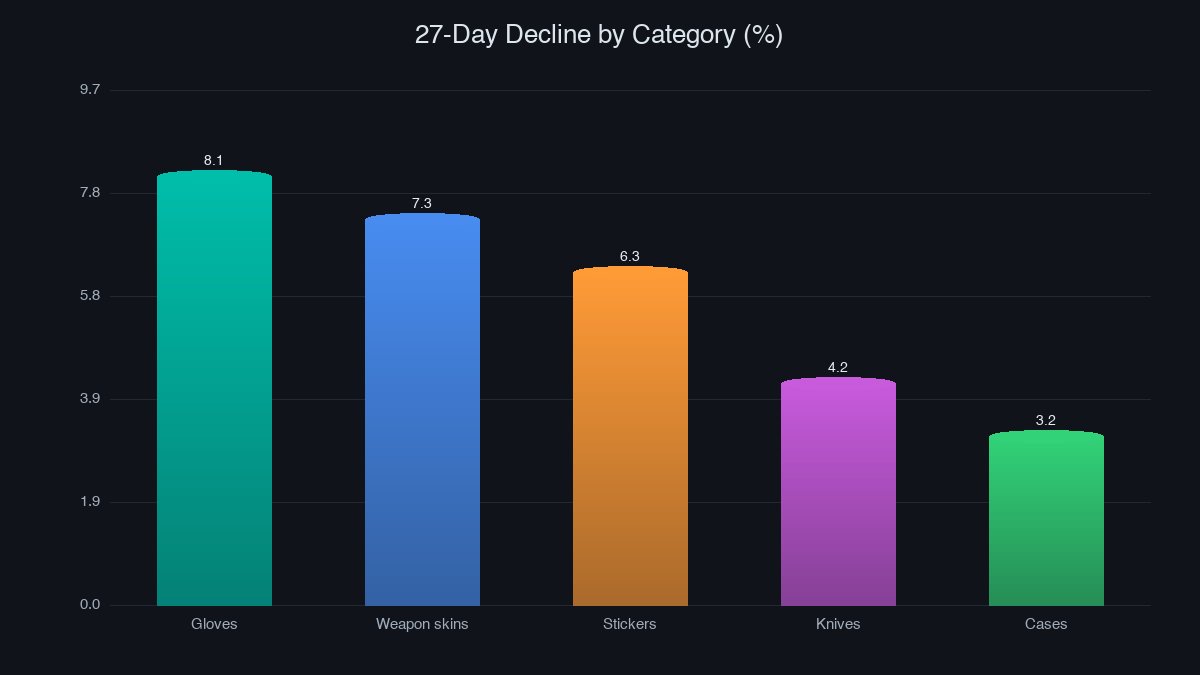
Gloves were the worst-performing segment at −8.1%, with 401 listings dropping against just 48 gaining. Weapon skins fell 7.3% (5,726 down, 1,405 up), stickers 6.3%, and knives 4.2%. Cases and containers were the most defensive category in the whole dataset at −3.2%.
The glove result is not random. Gloves are the thinnest liquid market in CS2: SteamDB tracks only 94 glove items across 457,719 listings, versus 1,427 weapon skins across 29.2 million. Few listings means wide quotes and few buyers, so when sentiment turns, the quoted price gaps down instead of trading down. Knives, by contrast, have 604 tracked items but 1.13 million listings — enough depth to absorb sellers without a cliff.
The Round-Trip Cost Is Where the Real Damage Is
A falling index is uncomfortable. A falling index combined with a wide buy/sell spread is how people actually lose money, because the spread is charged before the market moves at all.
SteamDB's spread data, measured across 10,100 items with live quotes on both sides, puts the median round trip — buy at the cheapest ask, instant-sell into the best bid, fees included — at 27.5%. By category: knives 2.3%, gloves 3.3%, weapon skins 6.7%, cases 14.1%, and stickers 32.9%.
That single set of numbers reframes the whole "buy the dip" conversation. Buying a knife in a −4.2% month is survivable; you pay 2.3% to get in and out. Buying stickers in a −6.3% month is not a dip purchase, it is a 30% hole before the market does anything.
The USP-S | Purple DDPAT (Field-Tested) is a clean example of how this plays out on individual items. It fell from $5.55 to $3.85 on Steam in a week — a 30.6% drop against a typical weekly swing of 14.1% — while third-party marketplaces only moved 11.5%. Same skin, two very different prints, because the Steam quote carries the thinner book and the higher fee.
That gap is structural, not news. Veriloot's October 18 measurement across 3,382 skins found Steam priced a median 38.7% above the cheapest cash marketplace, and dearer in 99.9% of cases. If you are buying into weakness, you are paying that premium for the privilege unless you compare venues first.
Where Buyers Still Show Up
Volume has not disappeared, it has moved to the bottom of the price ladder. SteamDB's rolling daily sales counter shows the five most-traded containers as Revolution Case at 44,633 units a day for $0.14, Kilowatt Case at 41,270 for $0.08, Sealed Dead Hand Terminal at 25,361 for $0.24, Sealed Genesis Terminal at 18,688 for $0.04, and Fracture Case at 12,777 for $0.28.
There are also a handful of genuine counter-moves, all small-ticket and all update-driven rather than sentiment-driven. Glock-18 | Glockingbird (Factory New) rose 39.6% to $4.81 on 443 sales. P250 | Contaminant (Factory New) added 19.9% to $12 on 49 sales. AUG | Arctic Wolf (Battle-Scarred) gained 15.6% to $1.96, with third-party markets showing a stronger 32.4% move on the same item.
Then there is the noise you should ignore: Sticker | World Eaters 1 jumping from $0.20 to $22.34 on 412 Steam sales. That is a 110x move on a sticker with almost no float to speak of — a book so thin that one buyer resets the print. It is not a market signal, and it is not repeatable.
What a Five-Week Slide Actually Means for You
Three conclusions follow from the data, and none of them require a prediction.
First, the categories that fall hardest are the ones that cost the most to exit. Gloves at −8.1% with only 94 tracked items is a market with no cushion. If you need liquidity in the next month, that is the wrong place to park value.
Second, cheap containers are behaving like a separate asset class. Cases fell 3.2% while the median item fell 6.2%, because a $0.08 case is a functional purchase — people buy it to open it, not to hold it. Demand there tracks player activity, not trader confidence.
Third, the spread matters more than the trend in a market like this. A 2.3% knife spread means a −4.2% month costs you about 6.5% to round-trip. A 32.9% sticker spread means the same month costs you nearly 40%. Same headline, completely different outcome.
If you want to stay active without fighting the tape, the cheapest way to participate right now is at the container end of the market — small stakes, tight pricing, and no dependence on a top-end buyer showing up. You can see how that plays out in practice on the Phantom Cache opening page, where the entry cost is a fraction of what a single mid-tier knife costs and the downside is capped at the price of the case.
Five down weeks is not a crash. It is a repricing, and repricings reward people who check the spread before they check the chart.