All Five CS2 Categories Fell in October. Cases Dropped 3.7x Harder Than Stickers
All Five CS2 Categories Fell in October. Cases Dropped 3.7x Harder Than Stickers
If you held one item from each corner of the CS2 market through October — a sticker, a knife, a rifle skin, a pair of gloves, a case — you lost money on every single one of them. Not most. All five.
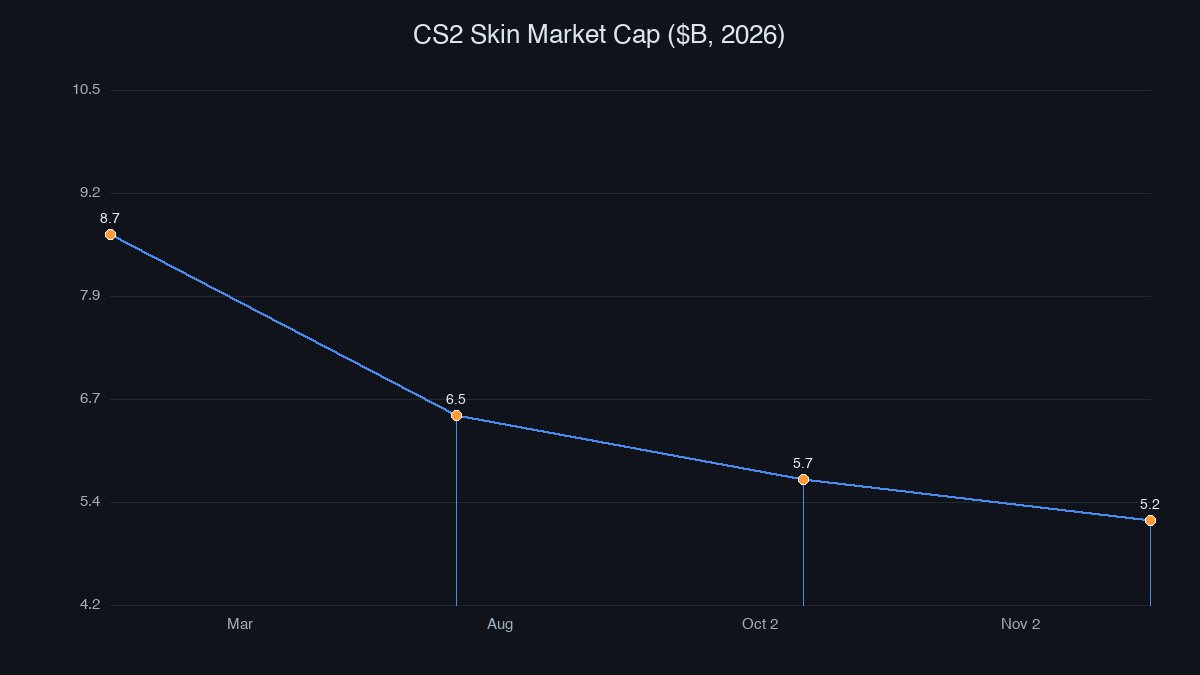
The total market cap sat at $5.23 billion on November 2. Thirty days earlier it was about $5.72 billion. That is roughly half a billion dollars of floor value erased in a single month, and it leaves the market 39.9% below the $8.71 billion record set in March 2026.
But the interesting part is not that everything fell. It is how unevenly. The spread between the best and worst category in October was nearly four to one, and the ranking that produced it says something specific about where this market's weight actually sits right now.
The Full October Scoreboard
CSMarketCap tracks five category indexes — stickers, knives, rifles, gloves and cases — and published all five 30-day changes checked on November 2. Here they are, ordered from most stable to weakest.
- Stickers: −2.92%
- Knives: −4.52%
- Rifles: −4.96%
- Gloves: −6.48%
- Cases: −10.72%
Cases lost 3.7 times as much as stickers. Gloves lost more than twice as much. Knives and rifles landed almost on top of each other, both under 5%.
Here is the detail that makes the list worth reading twice: four of the five categories fell less than the market cap itself. The headline number was −8.6% over 30 days, and only the case index beat that on the way down. That is not a market where one bad sector dragged everything else with it. That is a market where the average got worse than most of its own parts — which only happens when the weight inside the basket shifts while prices move.
#1 Stickers: −2.92%, the Only Corner That Held
The sticker index was the most stable place to hold value in October, and the reason is supply, not sentiment.
Tournament stickers stop being sold once their event ends. The number of copies in circulation stops growing. Every other category in this market can absorb new supply whenever Valve ships a drop, a case or a collection — stickers largely cannot. When buyers step back, a fixed-supply category has less room to fall than one that is still being printed.
That is also why the sticker result deserves a caveat. A 2.92% loss is still a loss. Stickers were the best performer in a market where nothing performed. Calling them a safe haven would be reading the ranking wrong.
#2 Knives: −4.52% and Quietly the Biggest Category
Knives came second on stability, and that matters more than the number suggests — knives are no longer one category among five. They have become the market's centre of gravity.
Knife value has held roughly flat through a year in which rifles lost enormous ground. Between mid-May and early October 2026, the knife index moved from $1.91 million to $1.95 million, up 1.8%, while the weapons index collapsed from $2.22 million to $0.74 million, down 66.8%. Most of that damage was rifles, which fell 67.3% over the same stretch — from $1.60 million to $0.52 million at the floor.
That is not a coverage artifact. The same source tracked 3,348 rifle items on May 15 and 3,349 on October 5. Same rifles, two thirds less value.
So when a knife loses 4.52% in a month, it is 4.52% off the half of the market that has been standing still since spring. It is the least dramatic number on the list and the most expensive one.
#3 Rifles: −4.96%, the Category Players Actually Think About
Rifles finished a hair behind knives, and the hair is the story here. For three years rifles and knives traded the lead in this market. In January 2026 weapon skins were actually ahead, 42.6% to 36.3%. As recently as May 15, weapons still led 41.2% to 35.4%.
Then the crossover happened on May 22, 2026, and rifles have not led since. By June 10 the split was 46.8% knives to 24.6% weapons. Since August 8, knives have been above half of total category value every single day.
A 4.96% October decline is therefore not the beginning of rifle trouble. It is a small continuation of a five-month slide that already removed two thirds of the category's floor value. The rifles in your inventory did not get 5% cheaper this month — they got 5% cheaper on top of the worst half-year in the category's history.
#4 Gloves: −6.48%, More Than Twice the Sticker Loss
Gloves are the smallest major category and the second-worst performer in October. They lost 6.48%, which is more than twice the sticker decline and roughly a third more than knives or rifles.
The long-run picture is just as flat as it sounds. Since March 2023, gloves have gone from $0.36 million to $0.24 million at the floor — down 33.0% — and their share of total category value has roughly halved, from 10.7% to 6.5%.
Gloves are the category where buyers are most likely to be shopping for a specific pattern or float rather than a commodity. That makes the index less representative of any single pair you might own, and it makes comparison shopping more valuable than the index itself. A glove index down 6.48% does not tell you what the pair you want costs today.
#5 Cases: −10.72%, the Weakest Corner of the Market
Cases were the worst category in October by a wide margin, and there are two structural reasons for it.
First, the basket is small. The case index follows only 44 items, so a handful of large price drops moves the whole reading. That cuts both ways — cases are the most volatile category to watch in either direction, and a 10.72% monthly move is not the same kind of signal as a 10.72% move in a basket of 3,000 rifles.
Second, cases keep arriving. New cases enter the market through drops every week. When demand cools, there is no shortage to hold prices up, and in a falling month that shows up first and hardest here.
None of that means every case got 10.72% cheaper. It means the basket did — and that a buyer checking Phantom Cache or any other case today is looking at a category where the downside has been concentrated, not spread.
What 694.1 Actually Means
The CSMarketCap composite index started at 1,000 on March 26, 2026. On November 2 it stood at 694.1 — 30.6% below its starting point, less than eight months after launch.
Breadth was just as weak as the headline. Of every item tracked, 68% finished October in the red. Roughly two out of three. When that many items fall at once, you are not looking at one bad skin, one bad collection, or one bad case. You are looking at the whole market repricing together.
And the fall has not stopped. The last seven days of the period were still negative at −2.5%, which means November opened where October closed. Over 90 days the market is down 19.6% — about $1.27 billion — and more than a third of that 90-day damage happened in October alone.
For scale, compare it to the crash week of October 2025, when the market went from $8.63 billion to $4.81 billion in two days. Today's $5.23 billion is only about 9% above that bottom.
Where This Leaves a Buyer
The practical read from five red categories is not "wait for a bottom." Nobody knows where the floor is, and the last seven days argue it has not been found.
The read is that dispersion is now the market's defining feature. Stickers and cases diverged by 7.8 percentage points in a single month. Knives and rifles sat within half a point of each other while being separated by three years of opposite trajectories. A single "market is down" number describes almost none of that.
For anyone actually buying rather than watching, that dispersion is the whole opportunity. In a month where 68% of items lost value, the gap between the cheapest listing and the average one is the part you control — not the direction of the index. Check the price on the specific item you want, in the specific wear, before you pay it. Compare a floor price against what the same skin fetches elsewhere. Then decide.
Stickers held best because supply stopped growing. Cases fell hardest because supply never stops. Between those two facts sits every decision this market is asking you to make right now — and none of them are answered by the headline number.