Only 9 of 1,184 CS2 Skins Gained Since March. All of Them Cost Under $3
Only 9 of 1,184 CS2 Skins Gained Since March. All of Them Cost Under $3
Nine. Out of one thousand one hundred and eighty-four comparable CS2 skins, exactly nine finished higher than they started. The other 1,175 lost more than 1%. The median skin is down 42.1% since March 2.
That number comes from CSDB's market-trends snapshot dated November 11, which reprices every skin it can match across comparable wear conditions against a fixed March 2 baseline. Ninety-nine percent of the tracked set is declining. When a dataset is that one-sided, the interesting part isn't the crowd — it's the nine things standing outside it, and what they have in common.
The Snapshot, Before Any Interpretation
Here is the raw output, in the order the source presents it:
- 9 skins gained more than 1% since March 2.
- 1,175 skins lost more than 1% over the same window.
- Median change across all comparable skins: -42.1%.
- Share of comparable skins declining: 99%.
The gainers, with the wear that sits at each skin's median and the actual prices attached:
- CZ75-Auto | Crimson Web — +24.5%, $2.12 to $2.64 (Field-Tested)
- MP7 | Cirrus — +15.0%, $1.80 to $2.07 (Minimal Wear)
- Dual Berettas | Panther — +14.4%, $2.36 to $2.70 (Field-Tested)
- P2000 | Red FragCam — +14.0%
Read those prices again. The best-performing skin in the entire market gained 52 cents. The second-best gained 27. Nothing on the winner list broke three dollars. Whatever happened to CS2 prices between March and November, it did not spare a single expensive item — not one knife, glove, AWP or Covert rifle made the list.
What the Nine Winners Actually Are
This is where most analyses stop, and where they go wrong. It's tempting to read nine green numbers as "cheap skins are the safe haven." That's not what the data says. What the data says is that a 24% move on a $2.12 item is 52 cents, and 52 cents on a two-dollar item is one seller changing their ask.
The CSDB methodology actually explains itself here: percentages are computed as the median change across each skin's comparable wear conditions, and the price shown is whichever wear sits at that median. On a skin with a handful of listings per wear tier, a single delisting can move the median. That's not a rally. That's an echo.
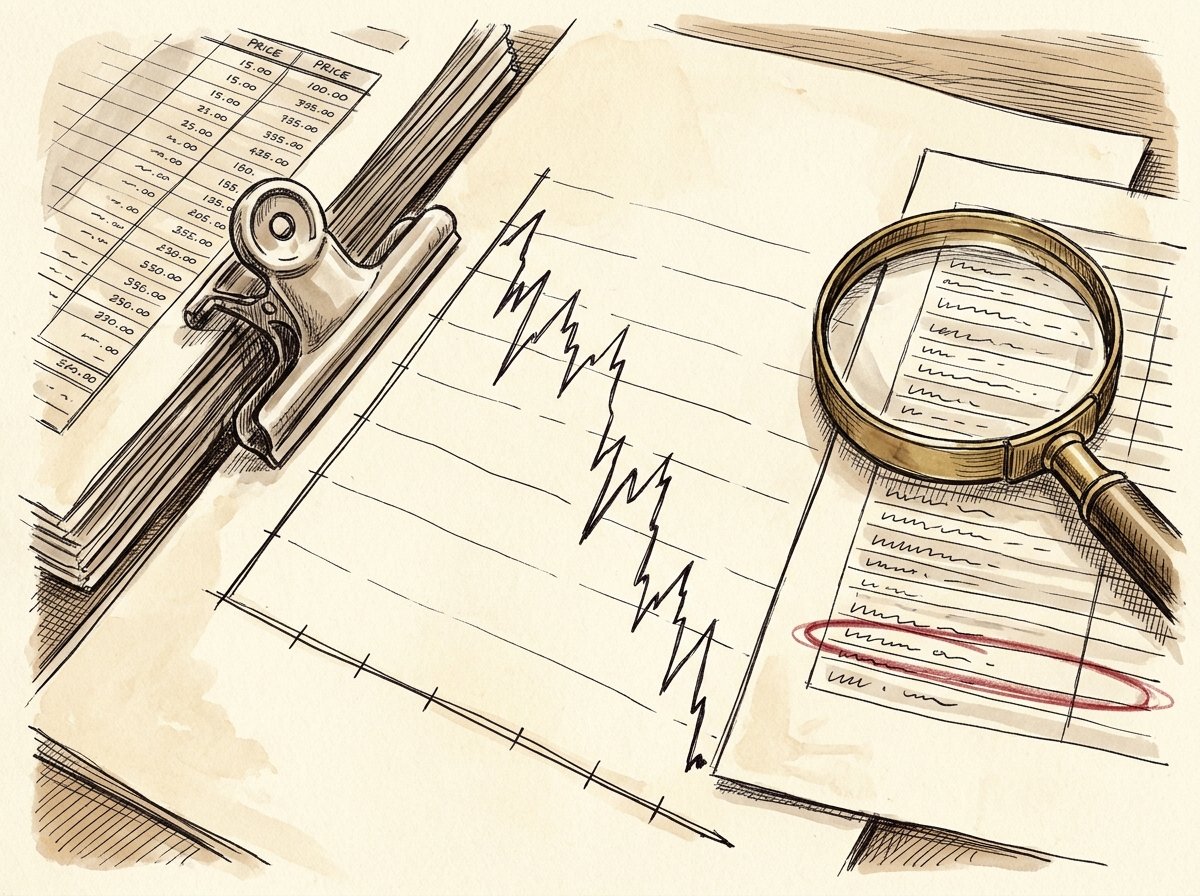
So the nine winners tell you almost nothing about where value survived. The real signal in the same dataset is the shape of the losses, because 1,175 observations is not noise.
The 42% and the 17% Cannot Both Be the Story
Here's the part I want you to sit with. Three separate trackers measured this same market over overlapping windows, and they came back with three different numbers.
- Median per-skin change since March 2: -42.1% (CSDB).
- CSDB Skin Index — a fixed basket of the 100 most-traded skins, started at 100 on July 13: 82.59, or -17.41% across 67 snapshots.
- Total estimated market capitalization: roughly $9.5 billion in mid-March to about $5.8 billion in early November, a loss near 40% (skin.club's estimate, and trackers disagree on the absolute figure).
A 42% median loss and a 17% basket loss are not a contradiction. They're a measurement of the same thing from two ends. The median skin is whatever sits in the middle of 1,184 items — mostly low-tier, thinly traded, one or two listings per wear. The basket is the 100 most-traded skins in the game, the stuff that actually changes hands thousands of times a week. The gap between -42% and -17% is the price of liquidity, and it is 25 percentage points wide.
SteamAnalyst's numbers point the same direction from a third angle. Over seven days to November 11 it tracked 10.3K items, logged 214.9K confirmed sales — 129.0K on Steam, 86.0K on CSFloat — and found 32% of tracked skins up, 15% flat, 53% down, for a net index move of -1.8% on the week. Half the market falling, and the index barely moves. Same mechanism: breadth and magnitude are different statistics, and the liquid names dominate the index while the illiquid ones dominate the count.
Where the Losses Actually Live
Break the drawdown out by category and the liquidity story gets sharper, not muddier. CSDB's median change by weapon group, March 2 to November 11:
- Gloves: -47.3% across 72 skins compared
- Knives: -47.0% across 306
- SMGs: -42.9% across 142
- Pistols: -39.3% across 247
- Rifles: -38.9% across 312
- Heavy: -37.3% across 103
The two most expensive categories took the worst hit. Gloves and knives are the items people buy as stores of value, and they lost roughly twice what Heavy weapons lost. That is the opposite of what a "flight to quality" looks like. Meanwhile the individual worst performers were brutal: Dual Berettas | Drift Wood fell -88.8% from $2.24 to $0.25. CZ75-Auto | Midnight Palm lost 88.2%, FAMAS | CaliCamo 87.7%. Galil AR | Dusk Ruins dropped from $42.50 to $5.68 — a real item, a real 86.6% loss, not a rounding artifact.
Now put that next to the CSDB index table, where every one of nine tracked indices is below its starting level, from -20.3% to -4.3%. The SMG Index is weakest at -20.28%. AWP sits at -6.76%, Pistol at -6.44%, and the Sticker Index — the only category built on permanent supply destruction, since applied stickers are consumed forever — is the most resilient at -4.33%. The source is careful to note those indices start from different inception dates, so they're comparable in direction rather than in age. Direction is enough: nothing is up, and what's down least is what trades most.
What This Means If You Own Something
Two conclusions, and I'll keep them narrow because the data doesn't support more.
First: the "nine winners" list is not a buying screen. It's a demonstration that percentage moves on sub-$3 skins are unreadable without a volume check. If you want to know whether a cheap skin is genuinely bid up, you need listing counts and confirmed sales, not a change column. The 11 items that "moved 400%" in a single week earlier this month were the same illusion dressed in bigger numbers.
Second: liquidity was the only hedge that worked. Not rarity — knives and gloves were the worst categories. Not hype — Charms are down about 75% from their launch. Not category — every category fell. The 100 most-traded skins lost 17.4% while the median skin lost 42.1%, and that is the single most actionable line in eight months of market data. If you're holding something you can't sell in a week at a quoted price, the quote is not a price.
Where this goes next: the decline is decelerating, which the player-count data supports — CS2 averaged about 792,000 concurrents over the last 30 days, down 287,000 from spring, but September lost only 19,600 and October only 8,300, versus 94,000 in April alone. A market that stops falling fast usually stops falling flat. It doesn't usually snap back to March levels, and anyone pricing a 40% recovery into a thinly traded Covert rifle is pricing a market that no longer exists.
If you do want to buy this tape, buy where the exits exist. Browsing the skin marketplace with a volume filter in your head beats chasing a green percentage on a two-dollar pistol — and it's a lot cheaper than learning the liquidity lesson the way the Dusk Ruins holders did.