Your CS2 Skin Has Eight Prices. This Week the Cheapest One Moved.

Your CS2 Skin Has Eight Prices. This Week the Cheapest One Moved.
Pick any CS2 skin worth more than a dollar and price it on eight marketplaces at the same moment. You will not get one number. You will get a spread. And in the week of 16–22 November, that spread moved faster than the headline index did.
The TradeUp Academy catalog, which tracks 28,107 items across eight venues, put total estimated value at $20.77 million for Week 47, down 3.34% week over week. That is the dull number. The interesting one sits underneath: which venue held the lowest price for a given item — and how that venue changed in seven days.
What "Lowest Price" Actually Measures
The metric is narrow on purpose. For each item in the catalog, the tracker checks every marketplace and records only one thing: who had the cheapest listing. Not sales volume, not liquidity, not who actually moved the item. Just who was quoting the best number at snapshot time.
That makes it a map of supply routing rather than a map of demand. If a venue's share of "lowest price" grows, more sellers there are undercutting everyone else. If its share shrinks, either its sellers pulled listings or another venue got aggressive.
Across Week 47, eight venues split the lowest-price role almost perfectly: Buff163 33.91%, Steam 16.67%, DMarket 14.28%, Skinport 11.10%, HaloSkins 9.09%, SkinBaron 8.36%, Market.CSGO 4.88%, Waxpeer 1.71%. Add them up and you get a hundred — every item in the catalog had exactly one cheapest home.
One caveat worth stating plainly: the catalog's headline "items tracked" figure and its "items with a price" figure are not the same thing. Week 47 reported 28,107 tracked items but 38,006 records that carried a usable price, up 38 on the week. The extra rows are wear variants and StatTrak duplicates of the same underlying skin. They matter because the same knife with a different float is priced as a separate line, and it can have a different cheapest venue. A Field-Tested copy living on one platform and a Factory New copy living on another is the normal case, not an anomaly.
The 2.58-Point Hole in Buff163's Lead
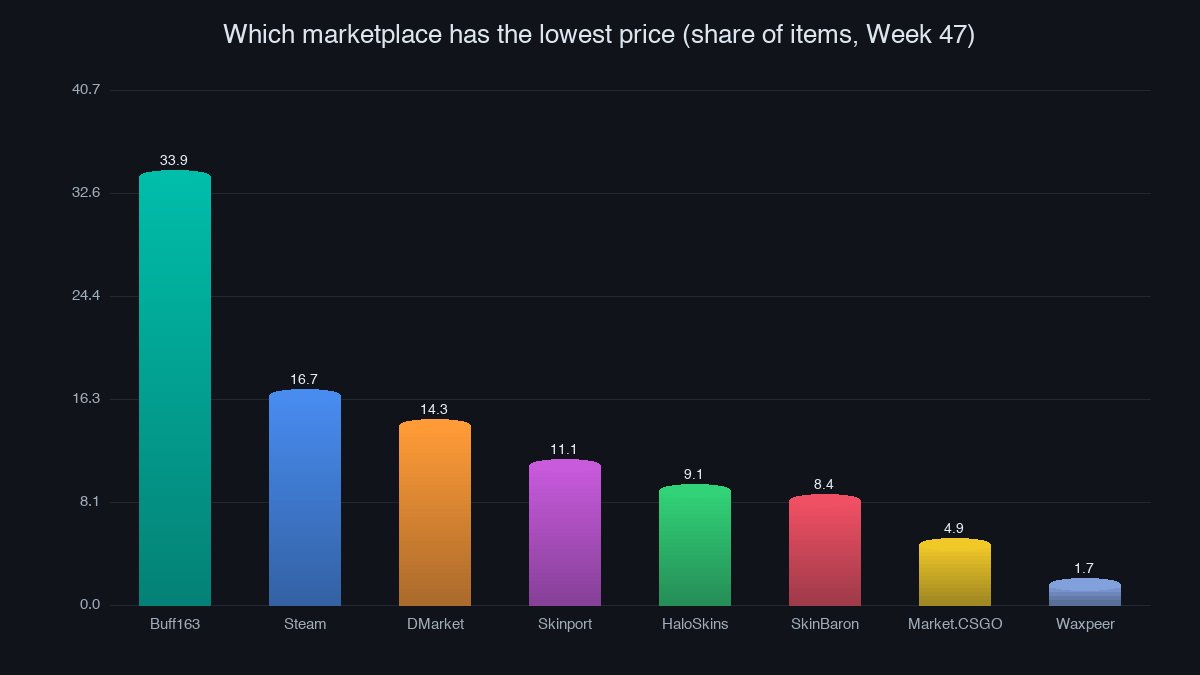
Buff163 still owns a third of the lowest-price book, which is a remarkable position given how much of the Western market never touches it. But it lost 2.58 percentage points in a single week, sliding from 36.49% to 33.91%. Nothing else in the catalog moved that far in either direction.
The gains were spread thin and wide. SkinBaron picked up 0.90 points — proportionally the biggest winner, nearly a 12% jump in its own share. Steam added 0.52, Market.CSGO 0.46, DMarket 0.40, Skinport 0.32, HaloSkins 0.14. Only Waxpeer joined Buff163 on the losing side, down 0.16.
Read that pattern carefully. One venue lost two and a half points while six venues each gained a fraction. That is not a market rotating from A to B. That is a single large pool of listings thinning out and the rest of the field absorbing the slack in small pieces. For a buyer, it means the "just check the big one" habit got measurably worse this week — not because Buff163 got expensive, but because it stopped being the cheapest answer as often.
Why the Cheap End Barely Notices
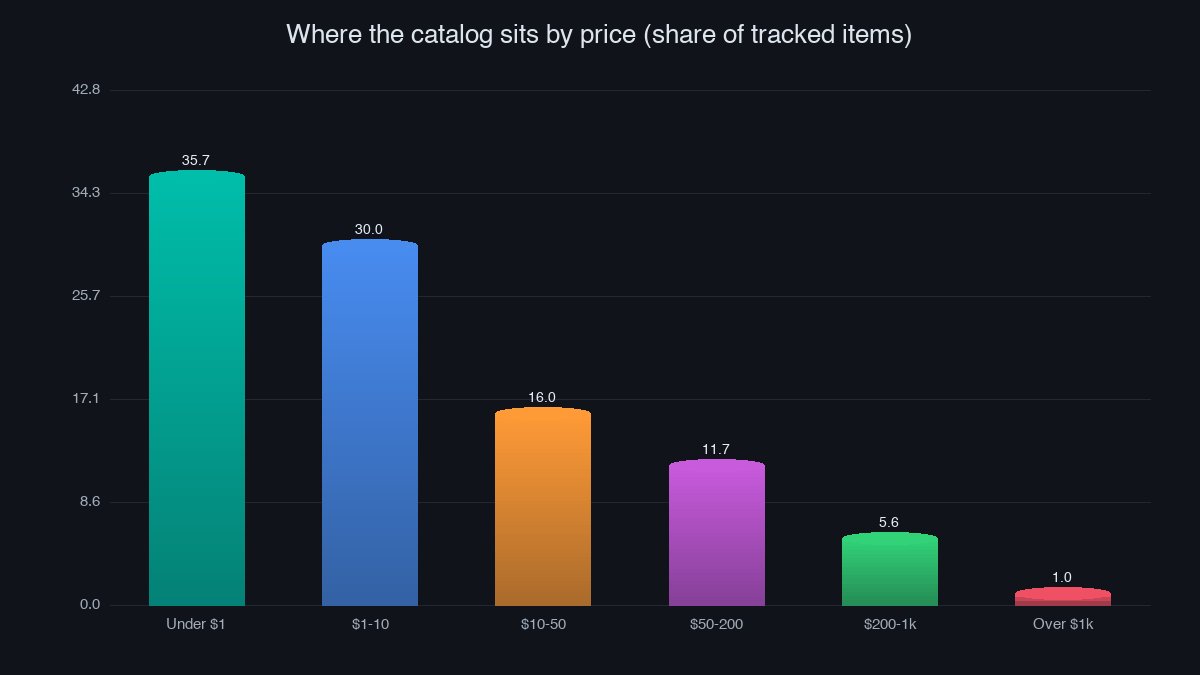
Here is where the eight-venue story loses most of its drama. 35.69% of tracked items have a best price under $1. Another 29.96% sit between $1 and $10. Two-thirds of the entire catalog trades below ten dollars.
On a $1.40 skin, a 4% venue gap is five cents. Nobody reroutes a purchase over five cents, and nobody's portfolio changes because of it. The spread only becomes real money in the tail: 11.66% of items land between $50 and $200, 5.64% between $200 and $1,000, and 1.02% clear $1,000.
That last 1% is where the venue question actually pays. A 4% gap on a $1,200 knife is $48 — more than the entire value of thirty average skins. And because the expensive end is thin, a single seller relisting on a different platform can swing the lowest-price share for that item without any change in the broader market.
Run the arithmetic on the two bands side by side and the asymmetry is stark. Assume a uniform 3% venue spread, which is conservative against the 2.58-point swing measured this week. On a $2.00 skin that is six cents — inside the noise of any listing fee. On a $200 skin it is $6. On a $2,000 knife it is $60, which is roughly a full wear tier's difference on a mid-range budget knife. Same percentage, three completely different decisions.
This is also why "cheapest marketplace" leaderboards are quietly misleading. A venue that wins the lowest-price title on 33.91% of items may be winning most of those titles on skins nobody is buying in volume, while the handful of five-figure listings that actually carry the catalog's value sit somewhere else entirely.
The Top of the Book Is Where the Value Sits
Knives made up 45.84% of the catalog's estimated value in Week 47 despite being a tiny slice of the item count. Weapon skins contributed 30.45%, cases 10.75%, stickers 6.46%, gloves 4.57%, agents 1.11%. Weighted by dollars, this is a knife market with a hobby attached.
The StatTrak premium held at a median 32.4% across 3,133 matched pairs, up 0.42 points on the week. That is a stable number in an unstable market, and it tells you something specific: collectors are not repricing the StatTrak concept, they are repricing the underlying skins. The multiplier travels with the base item.
Combine those two facts and the practical rule falls out. If you are shopping in the sub-$10 band, venue choice is noise and you should optimise for speed and trust. If you are shopping knives, gloves, or anything StatTrak above a few hundred dollars, the 2-to-5 point venue spread is the largest controllable variable in the transaction.
What It Means While the Index Is Falling
The backdrop matters because a falling market changes seller behaviour before it changes buyer behaviour. SteamAnalyst's tracked cap sat at $171.2 million on 21 November — down 4.24% over seven days and 10.79% over thirty. Its index printed 650.1, off 1.82% on the week. On the day itself, 4,182 items rose, 5,343 fell, and 15,417 went nowhere.
CSGAIN's index closed the week of 9–15 November at 66.2, a third consecutive weekly decline, and described it as the lowest level since tracking began, down 33.8% from the May baseline. That was measured across 495 tracked inventories.
When prices slide, sellers chase the bid. They relist wherever the last sale printed highest, and platforms with the deepest buyer pool temporarily stop being the cheapest place to buy. That is exactly the shape Week 47 shows: the venue with the biggest listing base lost share of the lowest-price book while smaller regional venues picked up the overflow. A 2.58-point drop in one week is what seller migration looks like before it shows up in any average.
The takeaway is not that one marketplace is winning. It is that the spread between the eight is live data, it moves weekly, and it moves hardest on precisely the items where the money is. Check the number before you assume the venue — on a $49 knife the difference is a coffee, on a $1,800 one it is a weekend.
If you want to see the live spread against real inventory rather than a weekly snapshot, the skinvs marketplace lists every item with its current ask, so you can compare it against whatever venue the tracker names. And if you would rather test the cheap end of the catalog yourself, the Silent Form case drops items that live entirely inside that sub-$10 band — the zone where the eight-venue question barely applies, and where the only number that matters is what you paid to open it.