CS2's Skin Market Went From $10.4 Billion to $6.5 Billion in Eleven Months

CS2's Skin Market Went From $10.4 Billion to $6.5 Billion in Eleven Months
On 15 October 2025, the total value of every Counter-Strike skin in circulation reached $10.4 billion. That was the peak — the highest number PriceEmpire had ever recorded for the market, the end of a two-year run that felt permanent to anyone holding inventory through it.
Eight days later, Valve changed one rule, and the floor moved.
Eleven months on, the same tracker reads $6.77 billion, and a second one prints $6.54 billion. Roughly a third of the market is gone. Here is what actually happened, in order — because the sequence matters far more than the headline number.
The Eight Days That Cost $2.4 Billion
On 22 October 2025, Valve let players trade up five Covert skins into a knife or a pair of gloves from the same collection. Knives and gloves had been the exclusive prize of case opening for a decade — the 0.26% gold tier, the entire reason keys cost money. Trade-up contracts turned them into something you could manufacture out of red-tier skins instead.
The reaction was immediate and violent. Within 38 hours the market cap had roughly halved, from about $6 billion to about $3 billion. Knives took the worst of it, because knife scarcity was precisely the thing being replaced. By 1 November 2025 the market had settled at $8 billion, down $2.4 billion from the October peak in barely two weeks.
And then it stopped falling, which is where most people's memory of this story gets fuzzy.
Two Recoveries, Then a Long Slide
The market did not die. It recovered hard. By 3 December 2025 it was back at $9.5 billion. It dipped through the winter and climbed back to $9.5 billion again on 16 March 2026. Two separate recoveries to the identical level — which is exactly why a lot of holders concluded the trade-up panic had been absorbed and the worst was behind them.
It was not. After 16 March the number declined on most days, with a single notable bounce in early June that never changed the direction. By 21 August 2026 it sat at $6.77 billion. By mid-September a second tracker was printing $6,536,597,918, with the 90-day window at -16.1%. That is the shape of the last year: one catastrophic day, two convincing recoveries, and then eleven months of gradual decline that never produced a second headline moment to blame it on.
What Each Category Actually Lost
Market caps hide more than they reveal. The useful view is per-skin, and there is a clean one: 1,185 skins priced at the same wear on 2 March 2026 and again on 15 September 2026.
- 97% of those skins were cheaper in September than in March.
- The median skin lost 33.4%.
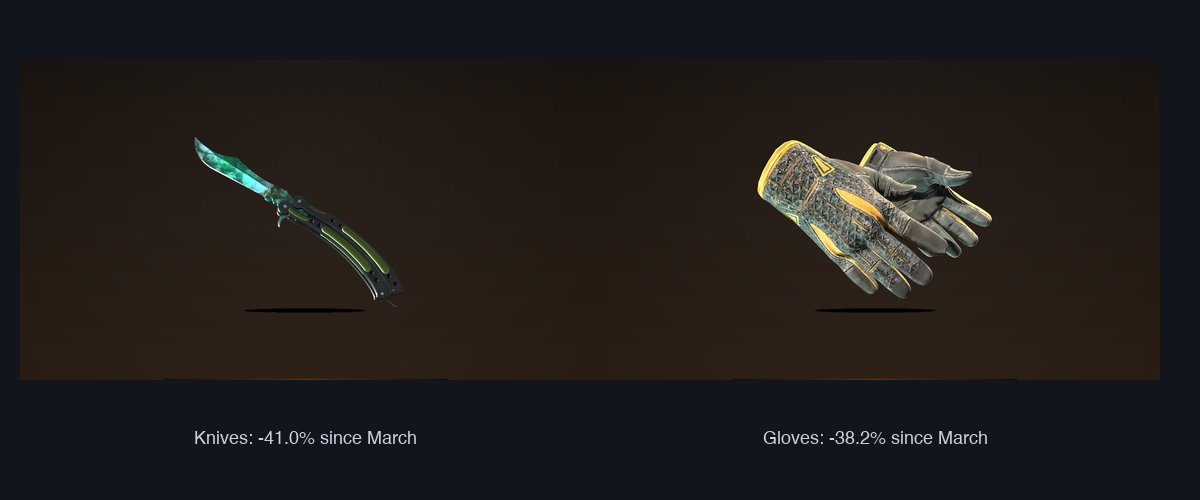
- Knives: -41.0% across 306 tracked skins — the steepest category in the game.
- Gloves: -38.2% across 72 skins. Gloves had the thinnest supply story of any category, and the only genuinely new pair since 2020 arrived with the Dead Hand Terminal in March 2026.
- Rifles: -31.3% across 312 skins. Pistols: -29.4% across 247. Heavy: -26.3% across 103.
Read the ordering, because it is the whole story. The largest declines are in exactly the tiers that used to be gatekept by rarity — knives first, gloves second, rifles third. The categories that fell least are the ones that were never priced on scarcity in the first place. This is what a scarcity shock looks like a year later: it does not reprice everything evenly. It re-rates the items whose price was mostly a premium for being hard to get.
Direction, Not Speed
Two broader trackers keep the same story at different zoom levels. An all-skins index benchmarked to January 2024 sits at 757.2 — a 23.9% decline from its first published level. A wider market index on the same base sits at 685.0, down 31.2%. Different membership rules, different rebalancing, same slope.
The short-term readings are messier, and being honest about them matters. Over the seven days to late September, one tracker counted 41% of tracked skins up and 46% down — a mixed week, not a crash week. The 30-day figure is -3.7%. The 90-day is -16.1%. Prices are falling, but slowly, with real two-way trading happening inside each window. A sentiment gauge built on the same data reads 35 — fear, not capitulation.
Liquidity explains why the daily readings feel so noisy. One broad tracker covering roughly 15,000 priced rows measures about $57 million traded over a trailing seven days against $5 billion of tracked value — turnover of barely more than 1%. In a market that thin, a single motivated seller can move a quoted price several percent, and a single patient buyer can anchor one for weeks. Neither move tells you anything about where the market is going; both show up in the 24-hour columns as signal anyway.
The Number Nobody Agrees On
That gap between "crash" and "correction" is where most of the current noise comes from. On 24 September a market piece led with a $3.9 billion crash — a figure that measures the drop from a peak. It is the same decline other trackers express as $6.54 billion of remaining market cap, or as down roughly one-third from the October 2025 high. All three are describing one eleven-month fall, from three different starting lines.
Which number you quote decides the story you tell. Peak-to-now sounds like a collapse. A 90-day reading of -16% sounds like an ordinary correction. And the per-skin data — 97% of skins cheaper, median -33.4% — is the only one that tells you what actually happened to a real inventory rather than to an aggregate.
Back to the Same Question
Which returns you to the two records that make this market genuinely hard to call. In December 2025 it climbed from $8 billion back to $9.5 billion. In March 2026 it did it again. Both recoveries were real, both were visible in the data for weeks, and both failed to hold. That is the honest state of things — not a crash, not a bottom, but a market that has spent a year re-pricing the items it used to price by rarity alone.
Two practical things follow. First, category matters more than direction: the -41% knives and the -26% heavy skins are not the same trade, and treating "the CS2 market" as a single asset is how people end up buying the wrong part of a decline. Second, the fee math has not moved at all — you still lose around 15% of whatever you sell through Steam, so any position needs roughly 18% just to get back to even in cash. At -3.7% over thirty days, that is a longer wait than most sellers plan for when they list.
If you are buying into this market rather than selling out of it, the useful move is the boring one: pick the specific item you actually want, check its wear tier and current lowest listing, and buy that exact copy rather than a representative one. Our marketplace lists knives and gloves by float, so two listings of the same skin stop looking identical, and the trade page is the route when you would rather swap inventory than sell into a falling bid. In a market where 97% of skins are cheaper than they were in March, knowing precisely which copy you are holding is worth more than any market call.