CS2's Skin Market Shed $3.5 Billion Since March — Is This the Floor?
CS2's Skin Market Shed $3.5 Billion Since March — Is This the Floor?
On March 26, the total value of every tracked CS2 item peaked at $8.71 billion. On November 2, that same measure read $5.23 billion. That is $3.48 billion gone in roughly seven months, and not one corner of the market escaped it.
The obvious question is whether this is the bottom. The honest answer is that nobody knows, but the data is unusually clear about what a bottom would have to look like — and we are not there yet.
What the Indexes Actually Say
CSMarketCap has been running a composite index since March 26, starting at 1,000. On November 2 it stood at 694.1. That is 30.6% below launch, and the pace has not slowed: the market lost 8.6% in the last 30 days and 19.6% over 90 days. October alone accounted for more than a third of the entire 90-day loss.
The speed matters more than the size. A market that drops 19.6% in three months and still drops 2.5% in the final week of that stretch is not decelerating into a floor. It is still falling at roughly the same rate.
Breadth confirms it. Of every item CSMarketCap tracks, 68% lost value over those 30 days. Caseway's weekly review is blunter still: the overall index has fallen for eight straight weeks, six of its segment indexes now sit at yearly lows, and 54.1% of liquid items declined in the most recent week, up from 48.8% the week before.
Here is the 30-day breakdown by category — this is the most useful table in the whole market right now, because it shows where the damage is concentrated:
- Stickers: −2.92% — the most stable corner of the market
- Knives: −4.52%
- Rifles: −4.96%
- Gloves: −6.48%
- Cases: −10.72% — the weakest, and 3.7x the sticker loss
Four of the five category indexes fell less than the headline market cap number. That sounds like good news until you notice what it implies: the headline is being dragged by something bigger than any single category average.
Where the Money Actually Went
Knives are 46.28% of the tracked catalog's total value. Weapon skins are 30.11%, cases 10.91%, stickers 6.3%, gloves 4.51%. When the knife index moves, the market cap moves with it, no matter what rifles or stickers do.
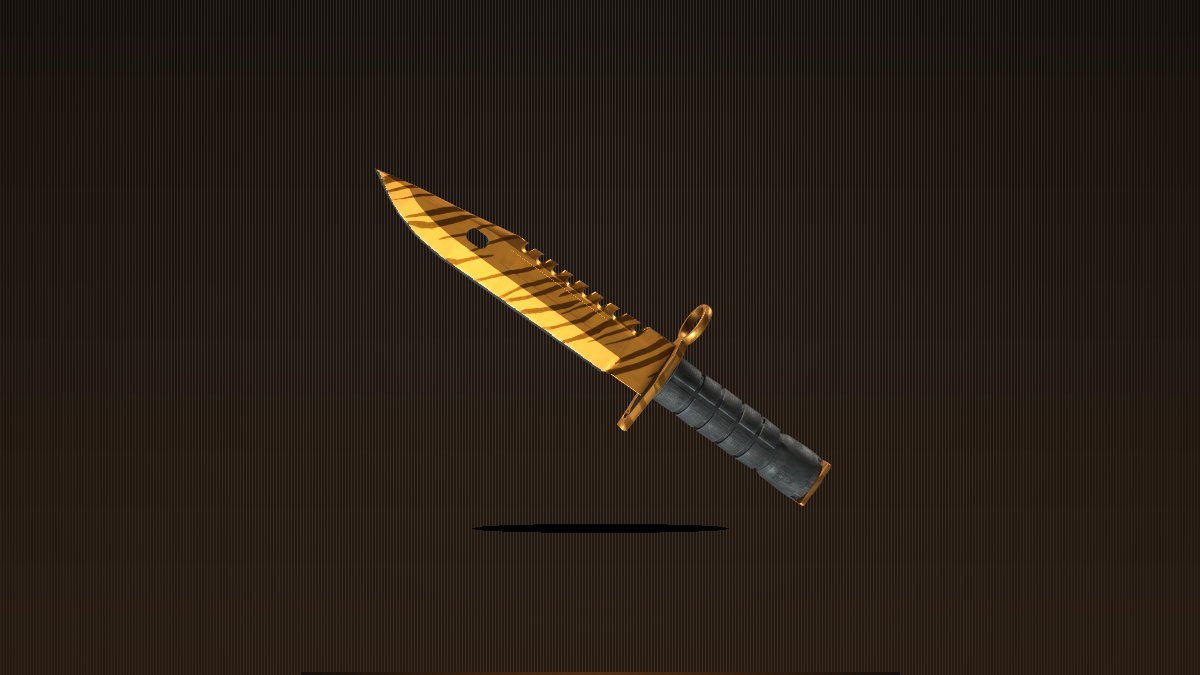
That is why a knife like this M9 Bayonet | Tiger Tooth (Factory New) is a better read on market health than any cheap rifle. It is one of the items that carries the headline. When premium knives lose a few percent, tens of millions of dollars of "market cap" evaporate without a single dramatic headline about any individual skin.
Turnover tells the same story from the other side. Steam traded $9.7 million in CS2 items in the last week Caseway measured, down 3.7%. The mix shifted away from rifles (−1.3pp) and pistols (−0.8pp) toward knives (+1.3pp) and stickers (+1.2pp). More of the week's money went into knives while knives were still losing value — a bigger slice of a smaller pie.
And the player base is not there to absorb it. CS2's 30-day average concurrent count has fallen to roughly 792,000, down from over one million eight months ago — about 287,000 players gone. Fewer buyers, more sellers, and a supply of cases that keeps dropping for free every week.
The Case Against Calling It
There is a real argument that this is not a floor, and it is not a bearish talking point — it is arithmetic.
Cases fell 10.72% and are still the weakest segment. Cases are the one thing in CS2 that arrives in unlimited quantity: every player who plays gets drops, forever. When the case index is the worst performer, supply is winning, and nothing in the current patch cycle changes that. The October 28 update added a Silent Reload toggle and an AMD rendering fix. The November 5 update touched Retakes defusal and map scripting. Neither does anything to item supply.
Without a supply event — a case removed from the drop pool, an Armory rotation, a retired collection — there is no mechanism to force prices up. Caseway's own forward-looking note expected the overall index to fall below 70.8 points in the following week. That is a forecast of more downside, not a bottom call.
What a Real Floor Would Look Like
This is the part worth saving. Bottoms in this market have historically shown up in breadth first, price second. Three signals would tell you the selling is exhausting:
- One of the eight-week losing streaks ends. Not all of them — one. A single segment breaking its streak is the first crack in the pattern.
- The share of declining liquid items falls below 48.8%. That was the reading two weeks before the current 54.1%. Falling back under it means fewer items are being marked down each week.
- Pistols hold above 82.9 points and gloves above 51.6. Both are at yearly lows right now. Pistols are 45% below their April peak. Closing a week above those levels without making a new low is the cheapest evidence of a floor you will get.
For context on how deep the hole is: across 1,185 skins with at least three comparable wears, 99% sit below their March 2 baseline, with a median change of −41.95%. A floor does not mean recovery. It means the median stops getting worse.
What This Means If You Are Holding
A falling market does not reward waiting. It rewards comparing. When 68% of items are being marked down at once, the only variable you control is which listing you buy from.
That gap is measurable. Across 1,083 skins priced at $5 or more with at least three marketplace quotes, the median spread between the cheapest and most expensive listing is 26.2% — and that is before you count Steam. On November 9, the three biggest marketplaces moved 109,546 items between them: MarketCSGO sold 75.2% of the items but took only 58.9% of the money, while Skinport sold 8.3% of the items and took 14.7% of it, at an average sale of $37.59 versus $16.63.
Same day, same game, two entirely different customers. If you are buying into weakness, you want the venue with the bigger average ticket and the tighter ask, not the one with the highest item count.
Practical takeaway: if you are still holding a knife-heavy inventory, the current 26% cross-market spread means the difference between a bad sale and a merely disappointing one is which marketplace you list on. If you are buying, the weakness is real and the entry prices are the best since the index launched — check the SkinVS marketplace for live knife and glove listings, or start smaller with a case from the Phantom Cache and watch how the odds actually pay before you commit capital to a falling knife market.
The floor is not in yet. But the data that will announce it is public, updated weekly, and free to read. That is more than most markets give you.